Idealized Sensitivity Study
Contents
Idealized Sensitivity Study
Throughout this document unmodified is unsed to describe the runs which used the original values of LANDUSE.TBL.
import pandas as pd
import numpy as np
import xarray as xr
from glob import glob
import matplotlib.pyplot as plt
import numpy as np
from datetime import datetime, timedelta
import matplotlib.pyplot as plt
from matplotlib.cm import get_cmap
from matplotlib.dates import DateFormatter
from netCDF4 import Dataset
from wrf import (getvar, to_np, vertcross, smooth2d, CoordPair,
                 get_basemap, latlon_coords, g_geoht, combine_files, ALL_TIMES)

# Suppress warnings so the notebook looks nice
import warnings
warnings.filterwarnings('ignore')

# Style for plotting
plt.style.use('default')

# N-ICE Measurements
## NOTE: SEB Measurements are in UTC
### Importing SEB dataset
Measurements_seb = xr.open_dataset('/Users/smurphy/all_datasets/nice_published_datasets/N-ICE_sebData_v1.nc', decode_times = False)

### Longwave radiation into dataframes
M_downlw = pd.DataFrame(Measurements_seb.variables['surface_downwelling_longwave_flux'].values,
                        index = pd.to_datetime(Measurements_seb.variables['unix_time'].values, unit = 's'), columns = ['lw'])
M_uplw = pd.DataFrame(Measurements_seb.variables['surface_upwelling_longwave_flux'].values,
                      index = pd.to_datetime(Measurements_seb.variables['unix_time'].values, unit = 's'), columns = ['lw'])

### Shortwave radiation into dataframes
M_downsw = pd.DataFrame(Measurements_seb.variables['surface_downwelling_shortwave_flux'].values,
                        index = pd.to_datetime(Measurements_seb.variables['unix_time'].values, unit = 's'), columns = ['sw'])
M_upsw = pd.DataFrame(Measurements_seb.variables['surface_upwelling_shortwave_flux'].values,
                      index = pd.to_datetime(Measurements_seb.variables['unix_time'].values, unit = 's'), columns = ['sw'])

###  Calculating net radiation
M_net = (M_downlw['lw'] - M_uplw['lw']) + (M_downsw['sw'] - M_upsw['sw'])

### Sensible and latent heat flux into dataframes
M_lat = -pd.DataFrame(Measurements_seb.variables['surface_downward_latent_heat_flux'].values,
                      index = pd.to_datetime(Measurements_seb.variables['unix_time'].values, unit = 's'), columns = ['lh'])
M_sen = -pd.DataFrame(Measurements_seb.variables['surface_downward_sensible_heat_flux'].values,
                      index = pd.to_datetime(Measurements_seb.variables['unix_time'].values, unit = 's'), columns = ['sh'])
## NOTE: sensible and latent heat flux negative to match WRF sign convention

### Temperature
T_meas = pd.read_excel('/Users/smurphy/Documents/PhD/datasets/nice_data/Ts.xlsx', index_col = 0)

## Soundings
MeasSoundings = xr.open_dataset('/Users/smurphy/all_datasets/nice_published_datasets/rsData_gridded.nc')
MeasSoundings_Times = pd.read_fwf('/Users/smurphy/all_datasets/nice_published_datasets/rsData_gridded_dates.txt', header = None)

MeasSoundings_Times.columns = ['year','month','day','hour','minute','second']
MeasSoundings_Times.index = pd.to_datetime(MeasSoundings_Times[['year', 'month', 'day', 'hour', 'minute', 'second']])

sounding_t = pd.DataFrame(MeasSoundings['temp'].values, index = MeasSoundings_Times.index, columns = MeasSoundings['height'].values)

sounding_ws = pd.DataFrame(MeasSoundings['ws'].values, index = MeasSoundings_Times.index, columns = MeasSoundings['height'].values)


sfc_relative_humidity = pd.DataFrame(MeasSoundings['rh'].values,
                           index = MeasSoundings_Times.index,
                           columns = MeasSoundings['height'].astype(str))

sfc_wind_direction = pd.DataFrame(MeasSoundings['wd'].values,
                           index = MeasSoundings_Times.index,
                           columns = MeasSoundings['height'].astype(str))

sfc_wind_speed = pd.DataFrame(MeasSoundings['ws'].values,
                           index = MeasSoundings_Times.index,
                           columns = MeasSoundings['height'].astype(str))

sfc_temperature = pd.DataFrame(MeasSoundings['temp'].values + 273.15,
                                index = MeasSoundings_Times.index,
                                columns = MeasSoundings['height'].astype(str))

sfc_pressure = pd.DataFrame(MeasSoundings['press'].values,
                             index = MeasSoundings_Times.index,
                             columns = MeasSoundings['height'].astype(str))


# Height above sea level (m)
sfc_height = sfc_relative_humidity.index.values

# Potential temperature (k)
k = 2/7 # constent for potential temperature equation
sfc_potential_temperature = sfc_temperature * (1000 / sfc_pressure) ** k

# Mixing ratio (g/kg)
# Using Clasius Clapperyon

# Saturation vapor pressure #hPa
sfc_saturation_vapor_pressure = 6.112 * np.exp(((17.67 * (sfc_temperature - 273.15)) / ((sfc_temperature - 273.15) + 243.5)))

# Vapor pressure
sfc_vapor_pressure = sfc_saturation_vapor_pressure * (sfc_relative_humidity / 100)

# Mixing ratio g/kg
sfc_mixing_ratio = 621.97 * (sfc_vapor_pressure / ((sfc_pressure) - sfc_vapor_pressure))
sfc_mixing_ratio.index = sfc_mixing_ratio.index.to_pydatetime()

# Set date format for plots throughout the notebook
myFmt = DateFormatter("%m/%d \n %H:%M:%S")
Case 1 - Winter Clear
fns = glob('/Volumes/seagate_desktop/idealized/case1/000101/wrfo*')
wrflist = list()
for fn in fns:
    wrflist.append(Dataset(fn))

# Defining start and end dates of case study
sdate = '2015-02-04'
edate = '2015-02-06'

sebmask = (M_downlw.index > sdate) & (M_downlw.index < edate)

#cldfra = getvar(wrflist, "CLDFRA", timeidx=ALL_TIMES, method="cat").mean('south_north').mean('west_east')
z = getvar(wrflist, "z").mean('south_north').mean('west_east')
#cldfra_df = pd.DataFrame(cldfra.values, index = cldfra.Time.values, columns = z)

lh = getvar(wrflist, "LH", timeidx=ALL_TIMES, method="cat").mean('south_north').mean('west_east')
lh_df = pd.DataFrame(lh.values, index = lh.Time.values)

sh = getvar(wrflist, "HFX", timeidx=ALL_TIMES, method="cat").mean('south_north').mean('west_east')
sh_df = pd.DataFrame(sh.values, index = sh.Time.values)

lwdnb = getvar(wrflist, "LWDNB", timeidx=ALL_TIMES, method="cat").mean('south_north').mean('west_east')
lwdnb_df = pd.DataFrame(lwdnb.values, index = lwdnb.Time.values)

lwupb = getvar(wrflist, "LWUPB", timeidx=ALL_TIMES, method="cat").mean('south_north').mean('west_east')
lwupb_df = pd.DataFrame(lwupb.values, index = lwupb.Time.values)

swdnb = getvar(wrflist, "SWDNB", timeidx=ALL_TIMES, method="cat").mean('south_north').mean('west_east')
swdnb_df = pd.DataFrame(swdnb.values, index = swdnb.Time.values)

swupb = getvar(wrflist, "SWUPB", timeidx=ALL_TIMES, method="cat").mean('south_north').mean('west_east')
swupb_df = pd.DataFrame(swupb.values, index = swupb.Time.values)

# Finding all wrfout file
fns = glob('/Volumes/seagate_desktop/idealized/landusetbl_modifications/1ClearWinter_000101/wrfo*')

# Creating an empty list to append to
wrflist = list()

# Opening the wrfout files and appending them to the empty list
for fn in fns:
    wrflist.append(Dataset(fn))

#cldfra_mod = getvar(wrflist, "CLDFRA", timeidx=ALL_TIMES, method="cat").mean('south_north').mean('west_east')
z_mod = getvar(wrflist, "z").mean('south_north').mean('west_east')
#cldfra_df_mod = pd.DataFrame(cldfra_mod.values, index = cldfra_mod.Time.values, columns = z_mod)

## lh - latent heat flux
lh_mod = getvar(wrflist, "LH", timeidx=ALL_TIMES, method="cat").mean('south_north').mean('west_east')
lh_df_mod = pd.DataFrame(lh_mod.values, index = lh_mod.Time.values)

## sh - sensible heat flux
sh_mod = getvar(wrflist, "HFX", timeidx=ALL_TIMES, method="cat").mean('south_north').mean('west_east')
sh_df_mod = pd.DataFrame(sh_mod.values, index = sh_mod.Time.values)

## lwdnb - downwelling longwave radiation
lwdnb_mod = getvar(wrflist, "LWDNB", timeidx=ALL_TIMES, method="cat").mean('south_north').mean('west_east')
lwdnb_df_mod = pd.DataFrame(lwdnb_mod.values, index = lwdnb_mod.Time.values)

## lwupb - upwelling longwave radiation
lwupb_mod = getvar(wrflist, "LWUPB", timeidx=ALL_TIMES, method="cat").mean('south_north').mean('west_east')
lwupb_df_mod = pd.DataFrame(lwupb_mod.values, index = lwupb_mod.Time.values)

## swdnb - downwelling shortwave radiation
swdnb_mod = getvar(wrflist, "SWDNB", timeidx=ALL_TIMES, method="cat").mean('south_north').mean('west_east')
swdnb_df_mod = pd.DataFrame(swdnb_mod.values, index = swdnb_mod.Time.values)

## swupb - upwelling shortwave radiation
swupb_mod = getvar(wrflist, "SWUPB", timeidx=ALL_TIMES, method="cat").mean('south_north').mean('west_east')
swupb_df_mod = pd.DataFrame(swupb_mod.values, index = swupb_mod.Time.values)
---------------------------------------------------------------------------
KeyboardInterrupt                         Traceback (most recent call last)
/var/folders/21/bhksj_cn7zz43y8x0m4gsh0h0000gn/T/ipykernel_54832/1427607582.py in <module>
     67
     68 ## swupb - upwelling shortwave radiation
---> 69 swupb_mod = getvar(wrflist, "SWUPB", timeidx=ALL_TIMES, method="cat").mean('south_north').mean('west_east')
     70 swupb_df_mod = pd.DataFrame(swupb_mod.values, index = swupb_mod.Time.values)

~/opt/anaconda3/lib/python3.8/site-packages/wrf/routines.py in getvar(wrfin, varname, timeidx, method, squeeze, cache, meta, **kwargs)
    334     if is_standard_wrf_var(wrfin, varname) and varname != "Times":
    335         _check_kargs("default", kwargs)
--> 336         return extract_vars(wrfin, timeidx, varname,
    337                             method, squeeze, cache, meta, _key)[varname]
    338     elif varname == "Times":

~/opt/anaconda3/lib/python3.8/site-packages/wrf/util.py in extract_vars(wrfin, timeidx, varnames, method, squeeze, cache, meta, _key)
   2276         varlist = varnames
   2277
-> 2278     return {var:_extract_var(wrfin, var, timeidx, None,
   2279                              method, squeeze, cache, meta, _key)
   2280             for var in varlist}

~/opt/anaconda3/lib/python3.8/site-packages/wrf/util.py in <dictcomp>(.0)
   2276         varlist = varnames
   2277
-> 2278     return {var:_extract_var(wrfin, var, timeidx, None,
   2279                              method, squeeze, cache, meta, _key)
   2280             for var in varlist}

~/opt/anaconda3/lib/python3.8/site-packages/wrf/util.py in _extract_var(wrfin, varname, timeidx, is_moving, method, squeeze, cache, meta, _key)
   2213     else:
   2214         # Squeeze handled in this routine, so just return it
-> 2215         return combine_files(wrfin, varname, timeidx, is_moving,
   2216                              method, squeeze, meta, _key)
   2217

~/opt/anaconda3/lib/python3.8/site-packages/wrf/util.py in combine_files(wrfin, varname, timeidx, is_moving, method, squeeze, meta, _key)
   2115         outarr = _combine_dict(wrfseq, varname, timeidx, method, meta, _key)
   2116     elif method.lower() == "cat":
-> 2117         outarr = _cat_files(wrfseq, varname, timeidx, is_moving,
   2118                             squeeze, meta, _key)
   2119     elif method.lower() == "join":

~/opt/anaconda3/lib/python3.8/site-packages/wrf/util.py in _cat_files(wrfseq, varname, timeidx, is_moving, squeeze, meta, _key)
   1685             break
   1686         else:
-> 1687             vardata = wrfnc.variables[varname][:]
   1688
   1689             numtimes = vardata.shape[0]

netCDF4/_netCDF4.pyx in netCDF4._netCDF4.Variable.__getitem__()

netCDF4/_netCDF4.pyx in netCDF4._netCDF4.Variable._toma()

~/opt/anaconda3/lib/python3.8/site-packages/numpy/__init__.py in __getattr__(attr)
    267             # Warn for expired attributes, and return a dummy function
    268             # that always raises an exception.
--> 269             try:
    270                 msg = __expired_functions__[attr]
    271             except KeyError:

KeyboardInterrupt:
wrfstat = xr.open_dataset('/Volumes/seagate_desktop/idealized/case1/000101/wrfstat_d01_2015-02-04_00:00:00')
cst_qc = wrfstat['CSP_QC']
cst_tsk = wrfstat['CST_TSK']
cst_sh = wrfstat['CST_SH']
cst_lh = wrfstat['CST_LH']
cst_time = wrfstat['Times']
csp_z = wrfstat['CSP_Z']
csp_u = wrfstat['CSP_U']
csp_v = wrfstat['CSP_V']
csv_qv = wrfstat["CSP_QV"]

qc = pd.DataFrame(cst_qc.values,
                  index = pd.date_range(start='2/4/2015 00:00:00', end='2/6/2015 22:00:00', freq = '30min'),
                  columns = csp_z.isel(Time = 1).values)
sh_df = pd.DataFrame(cst_sh.values,
                  index = pd.date_range(start='2/4/2015 00:00:00', end='2/6/2015 22:00:00', freq = '30min'), columns = ['sh'])
lh_df = pd.DataFrame(cst_lh.values,
                  index = pd.date_range(start='2/4/2015 00:00:00', end='2/6/2015 22:00:00', freq = '30min'), columns = ['lh'])
tsk_df = pd.DataFrame(cst_tsk.values,
                  index = pd.date_range(start='2/4/2015 00:00:00', end='2/6/2015 22:00:00', freq = '30min'), columns = ['tsk'])
u_df = pd.DataFrame(csp_u.values,
                  index = pd.date_range(start='2/4/2015 00:00:00', end='2/6/2015 22:00:00', freq = '30min'),
                  columns = csp_z.isel(Time = 1).values)
v_df = pd.DataFrame(csp_v.values,
                  index = pd.date_range(start='2/4/2015 00:00:00', end='2/6/2015 22:00:00', freq = '30min'),
                  columns = csp_z.isel(Time = 1).values)
ws_df = np.sqrt(v_df**2 + u_df**2)
qv_df = pd.DataFrame(csv_qv.values,
                  index = pd.date_range(start='2/4/2015 00:00:00', end='2/6/2015 22:00:00', freq = '30min'),
                  columns = csp_z.isel(Time = 1).values)

cloudmask = wrfstat['CSV_CLDFRAC'].isel(south_north = round(len(wrfstat.south_north) / 2), west_east = round(len(wrfstat.west_east) / 2))
cloudmask_df = pd.DataFrame(cloudmask.values,
                  index = pd.date_range(start='2/4/2015 00:00:00', end='2/6/2015 22:00:00', freq = '30min'),
                  columns = csp_z.isel(Time = 1).values)

wrfstat = xr.open_dataset('/Volumes/seagate_desktop/idealized/landusetbl_modifications/1ClearWinter_000101/wrfstat_d01_2015-02-04_00:00:00')
cst_qc = wrfstat['CSP_QC']
cst_tsk = wrfstat['CST_TSK']
cst_sh = wrfstat['CST_SH']
cst_lh = wrfstat['CST_LH']
cst_time = wrfstat['Times']
csp_z = wrfstat['CSP_Z']
csp_u = wrfstat['CSP_U']
csp_v = wrfstat['CSP_V']
csv_qv = wrfstat["CSP_QV"]

qc_mod = pd.DataFrame(cst_qc.values,
                  index = pd.date_range(start='2/4/2015 00:00:00', end='2/6/2015 21:00:00', freq = '30min'),
                  columns = csp_z.isel(Time = 1).values)
sh_df_mod = pd.DataFrame(cst_sh.values,
                  index = pd.date_range(start='2/4/2015 00:00:00', end='2/6/2015 21:00:00', freq = '30min'), columns = ['sh'])
lh_df_mod = pd.DataFrame(cst_lh.values,
                  index = pd.date_range(start='2/4/2015 00:00:00', end='2/6/2015 21:00:00', freq = '30min'), columns = ['lh'])
tsk_df_mod = pd.DataFrame(cst_tsk.values,
                  index = pd.date_range(start='2/4/2015 00:00:00', end='2/6/2015 21:00:00', freq = '30min'), columns = ['tsk'])
u_df_mod = pd.DataFrame(csp_u.values,
                  index = pd.date_range(start='2/4/2015 00:00:00', end='2/6/2015 21:00:00', freq = '30min'),
                  columns = csp_z.isel(Time = 1).values)
v_df_mod = pd.DataFrame(csp_v.values,
                  index = pd.date_range(start='2/4/2015 00:00:00', end='2/6/2015 21:00:00', freq = '30min'),
                  columns = csp_z.isel(Time = 1).values)
ws_df_mod = np.sqrt(v_df_mod**2 + u_df_mod**2)
qv_df_mod = pd.DataFrame(csv_qv.values,
                  index = pd.date_range(start='2/4/2015 00:00:00', end='2/6/2015 21:00:00', freq = '30min'),
                  columns = csp_z.isel(Time = 1).values)

cloudmask = wrfstat['CSV_CLDFRAC'].isel(south_north = round(len(wrfstat.south_north) / 2), west_east = round(len(wrfstat.west_east) / 2))
cloudmask_df_mod = pd.DataFrame(cloudmask.values,
                  index = pd.date_range(start='2/4/2015 00:00:00', end='2/6/2015 21:00:00', freq = '30min'),
                  columns = csp_z.isel(Time = 1).values)
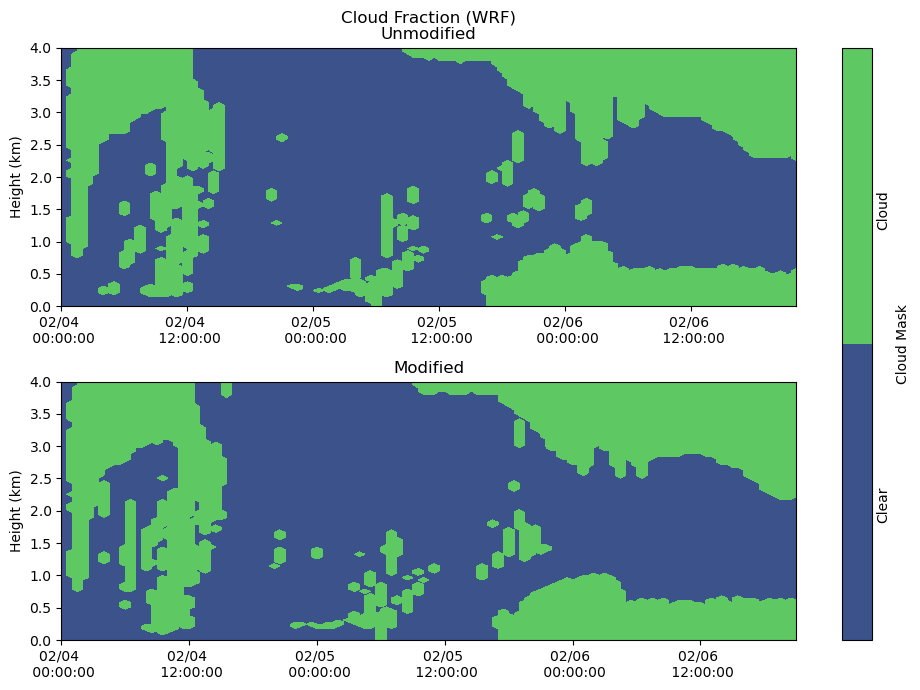
Clouds
fig, axs = plt.subplots(2, figsize=(10,7))

heatmap = axs[0].contourf(cloudmask_df.index, cloudmask_df.columns / 1000, cloudmask_df.T.values, levels = [-1, 0, 1])
axs[0].set_ylabel('Height (km)')
axs[0].set_title('Cloud Fraction (WRF)\nUnmodified')
axs[0].xaxis.set_major_formatter(myFmt)
axs[0].set_ylim(0,4)

heatmap = axs[1].contourf(cloudmask_df_mod.index, cloudmask_df_mod.columns / 1000, cloudmask_df_mod.T, levels = [-1, 0, 1])
axs[1].set_ylabel('Height (km)')
axs[1].set_title('Modified')
axs[1].xaxis.set_major_formatter(myFmt)
axs[1].set_ylim(0,4)
plt.tight_layout()

cbar = fig.colorbar(heatmap, ax=axs[:], ticks = [-0.5, 0.5], label = "Cloud Mask")
cbar.ax.set_yticklabels(['Clear','Cloud'], rotation = 90)
cbar.ax.tick_params(size=0)
plt.show()
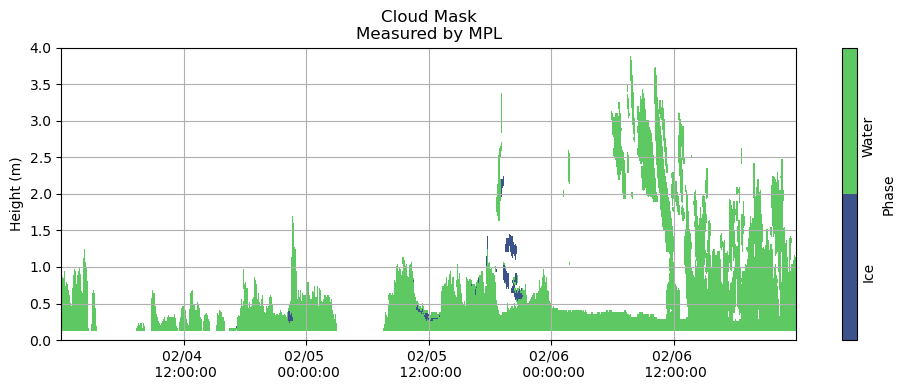
fns = ['/Volumes/seagate_desktop/data/MPL/Robert_MPLData/FinalNICELidarData/NICE_MPLDataFinal20150204.cdf',
       '/Volumes/seagate_desktop/data/MPL/Robert_MPLData/FinalNICELidarData/NICE_MPLDataFinal20150205.cdf',
       '/Volumes/seagate_desktop/data/MPL/Robert_MPLData/FinalNICELidarData/NICE_MPLDataFinal20150206.cdf']

measured_cloudmask_all = pd.DataFrame()

for fn in fns:
    rbt_cldmask = xr.open_dataset(fn)
    # Time is in UTC time stamp in fractional hours
    Time = rbt_cldmask.variables['DataTime'].values
    # Fix time to be a timestamp - Currently in hours
    yy = 2015
    mm = int(fn[-8:-6])
    dd = int(fn[-6:-4])
    date = [datetime(yy,mm,dd) + timedelta(seconds=hr*3600) for hr in Time[~np.isnan(Time)]]
    measured_cloudmask = pd.DataFrame(rbt_cldmask['PhaseMask'][~np.isnan(Time)].values, index = date, columns = rbt_cldmask['Range'])
    measured_cloudmask_all = pd.concat([measured_cloudmask_all, measured_cloudmask])

fig, ax = plt.subplots(figsize=(10,4))

plt.grid()
heatmap = plt.contourf(measured_cloudmask_all.index,
                       measured_cloudmask_all.columns / 1000,
                       measured_cloudmask_all.T.values,
                       [0, 1, 2])
# nan - no information
# 1 - cloud liquid
# 2 - cloud ice

plt.title('Cloud Mask\nMeasured by MPL')
plt.ylabel('Height (m)')
cbar = fig.colorbar(heatmap, label = 'Phase', ticks = [0.5, 1.5], orientation = 'vertical')
cbar.ax.set_yticklabels(['Ice', 'Water'], rotation = 90)
cbar.ax.tick_params(size=0)
plt.gca().xaxis.set_major_formatter(myFmt)
plt.ylim(0, 4)
plt.tight_layout()
plt.show()
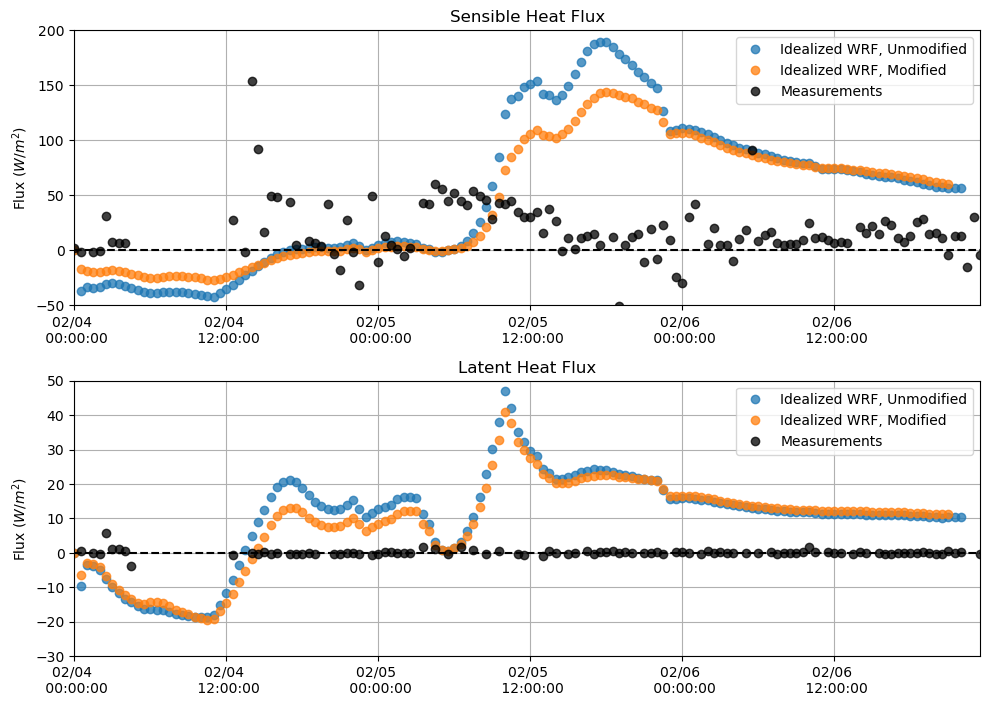
Sensible and Latent Heat Flux
plt.figure(figsize = (10,7))
plt.subplot(211)
plt.plot(sh_df, 'o', alpha = 0.75)
plt.plot(sh_df_mod, 'o', alpha = 0.75)
plt.plot(M_sen[sdate:edate], 'o', alpha = 0.75, color = 'k')
plt.hlines(0, xmin = M_lat[sdate:edate].index[0], xmax = M_lat[sdate:edate].index[-1], linestyle = '--', color = 'k')
plt.ylabel('Flux $(W/m^{2})$')
plt.title('Sensible Heat Flux')
plt.grid()
plt.legend(['Idealized WRF, Unmodified', 'Idealized WRF, Modified', 'Measurements'])
plt.ylim(-50,200)
plt.xlim(M_lat[sdate:edate].index[0],M_lat[sdate:edate].index[-1])
plt.gca().xaxis.set_major_formatter(myFmt)

plt.subplot(212)
plt.plot(lh_df, 'o', alpha = 0.75)
plt.plot(lh_df_mod, 'o', alpha = 0.75)
plt.plot(M_lat[sdate:edate], 'o', alpha = 0.75, color = 'k')
plt.hlines(0, xmin = M_lat[sdate:edate].index[0], xmax = M_lat[sdate:edate].index[-1], linestyle = '--', color = 'k')
plt.ylabel('Flux $(W/m^{2})$')
plt.title('Latent Heat Flux')
plt.grid()
plt.ylim(-30,50)
plt.legend(['Idealized WRF, Unmodified', 'Idealized WRF, Modified', 'Measurements'])
plt.xlim(M_lat[sdate:edate].index[0],M_lat[sdate:edate].index[-1])
plt.tight_layout()
plt.gca().xaxis.set_major_formatter(myFmt)
plt.show()
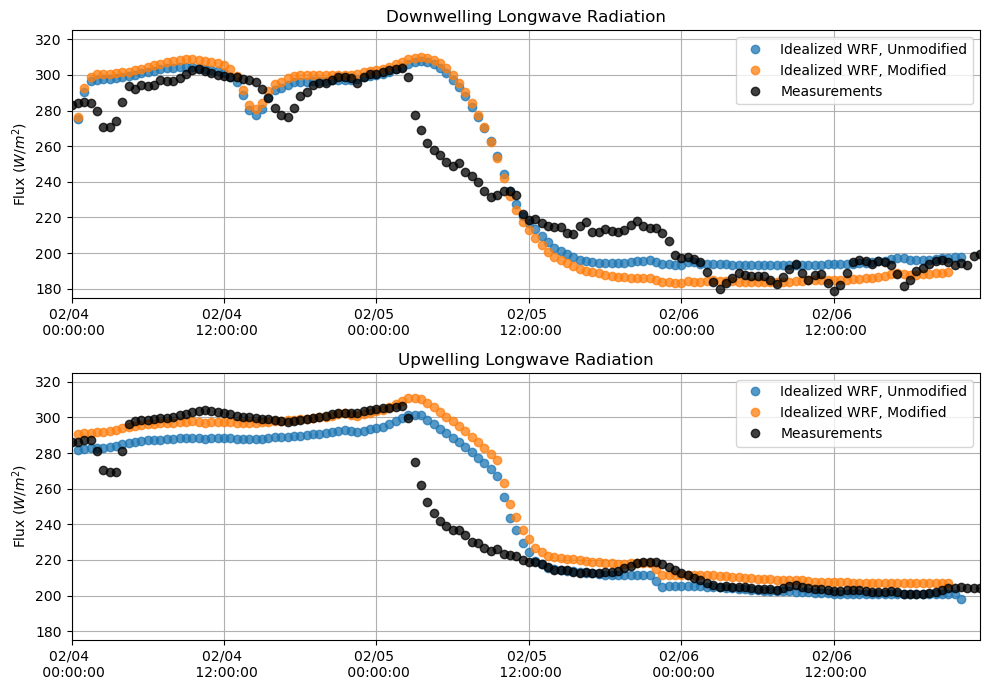
Longwave Radiation
plt.figure(figsize = (10,7))
plt.subplot(211)
plt.plot(lwdnb_df, 'o', alpha = 0.75)
plt.plot(lwdnb_df_mod, 'o', alpha = 0.75)
plt.plot(M_downlw[sdate:edate], 'o', alpha = 0.75, color = 'k')
plt.ylabel('Flux $(W/m^{2})$')
plt.title('Downwelling Longwave Radiation')
plt.grid()
plt.legend(['Idealized WRF, Unmodified', 'Idealized WRF, Modified', 'Measurements'])
plt.ylim(175,325)
plt.xlim(M_downlw[sdate:edate].index[0],M_downlw[sdate:edate].index[-1])
plt.gca().xaxis.set_major_formatter(myFmt)

plt.subplot(212)
plt.plot(lwupb_df, 'o', alpha = 0.75)
plt.plot(lwupb_df_mod, 'o', alpha = 0.75)
plt.plot(M_uplw[sdate:edate], 'o', alpha = 0.75, color = 'k')
plt.ylabel('Flux $(W/m^{2})$')
plt.title('Upwelling Longwave Radiation')
plt.grid()
plt.ylim(175,325)
plt.legend(['Idealized WRF, Unmodified', 'Idealized WRF, Modified', 'Measurements'])
plt.xlim(M_downlw[sdate:edate].index[0],M_downlw[sdate:edate].index[-1])
plt.gca().xaxis.set_major_formatter(myFmt)
plt.tight_layout()
plt.show()
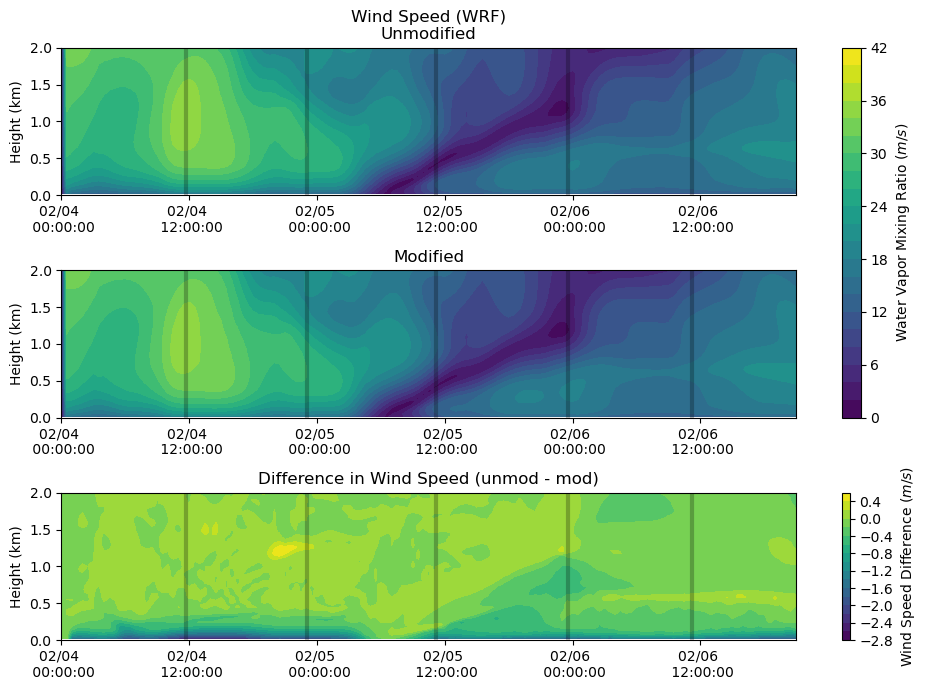
Wind Speed
fig, axs = plt.subplots(3, figsize=(10,7))

heatmap = axs[0].contourf(ws_df_mod.index, ws_df.columns / 1000, ws_df.T.values[:,:-2], levels = 20)
axs[0].set_ylabel('Height (km)')
axs[0].set_title('Wind Speed (WRF)\nUnmodified')
axs[0].xaxis.set_major_formatter(myFmt)
axs[0].set_ylim(0,2)
axs[0].vlines(sounding_ws[sdate:'2015-02-06'].index, 0, 2, color = 'k', alpha = 0.25, lw = 3)

heatmap = axs[1].contourf(ws_df_mod.index, ws_df_mod.columns / 1000, ws_df_mod.T.values, levels = 20)
axs[1].set_ylabel('Height (km)')
axs[1].set_title('Modified')
axs[1].xaxis.set_major_formatter(myFmt)
axs[1].set_ylim(0,2)
axs[1].vlines(sounding_ws[sdate:'2015-02-06'].index, 0, 2, color = 'k', alpha = 0.25, lw = 3)

heatmap_1 = axs[2].contourf(ws_df_mod.index, ws_df.columns / 1000, ws_df.T.values[:,:-2] - ws_df_mod.T.values, levels = 20)
axs[2].set_ylabel('Height (km)')
axs[2].set_title('Difference in Wind Speed (unmod - mod)')
axs[2].xaxis.set_major_formatter(myFmt)
axs[2].set_ylim(0,2)
axs[2].vlines(sounding_ws[sdate:'2015-02-06'].index, 0, 2, color = 'k', alpha = 0.25, lw = 3)

plt.tight_layout()
cbar = fig.colorbar(heatmap, ax=axs[0:2])
cbar.set_label('Water Vapor Mixing Ratio ($m/s$)')

cbar = fig.colorbar(heatmap_1, ax=axs[2])
cbar.set_label('Wind Speed Difference ($m/s$)')

plt.show()
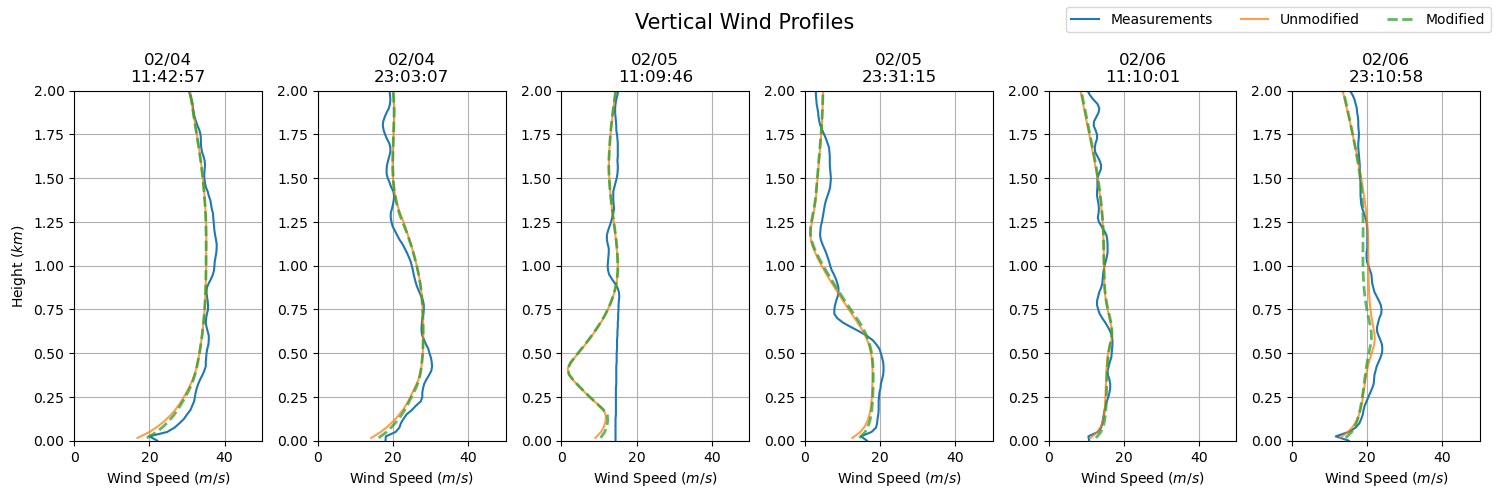
dates = sounding_ws[sdate:'2015-02-06'].index
fig, axs = plt.subplots(ncols = len(dates), figsize=(15,5))

for i in np.arange(0, len(dates), 1):
    prof = axs[i].plot(sounding_ws.loc[dates[i]], sounding_ws.loc[dates[i]].index / 1000, label = 'Measurements')
    axs[i].set_ylim(0, 2)
    axs[i].grid()
    axs[i].set_xlim(0, 50)
    axs[i].set_xlabel('Wind Speed ($m/s$)')
    axs[i].set_title(dates[i].strftime('%m/%d') + '\n' + dates[i].strftime('%H:%M:%S'))

    axs[i].plot(ws_df.iloc[ws_df.index.get_loc(dates[i], method = 'nearest')], ws_df.iloc[ws_df.index.get_loc(dates[0], method = 'nearest')].index / 1000, label = 'Unmodified', alpha = 0.75)
    axs[i].plot(ws_df_mod.iloc[ws_df_mod.index.get_loc(dates[i], method = 'nearest')], ws_df_mod.iloc[ws_df_mod.index.get_loc(dates[0], method = 'nearest')].index / 1000, '--', label = 'Modified', alpha = 0.75, lw = 2)

axs[0].set_ylabel('Height ($km$)')
plt.suptitle('Vertical Wind Profiles', fontsize = 15)
plt.tight_layout()

handles, labels = axs[0].get_legend_handles_labels()
fig.legend(handles, labels, loc='upper right', ncol = 3)

plt.show()
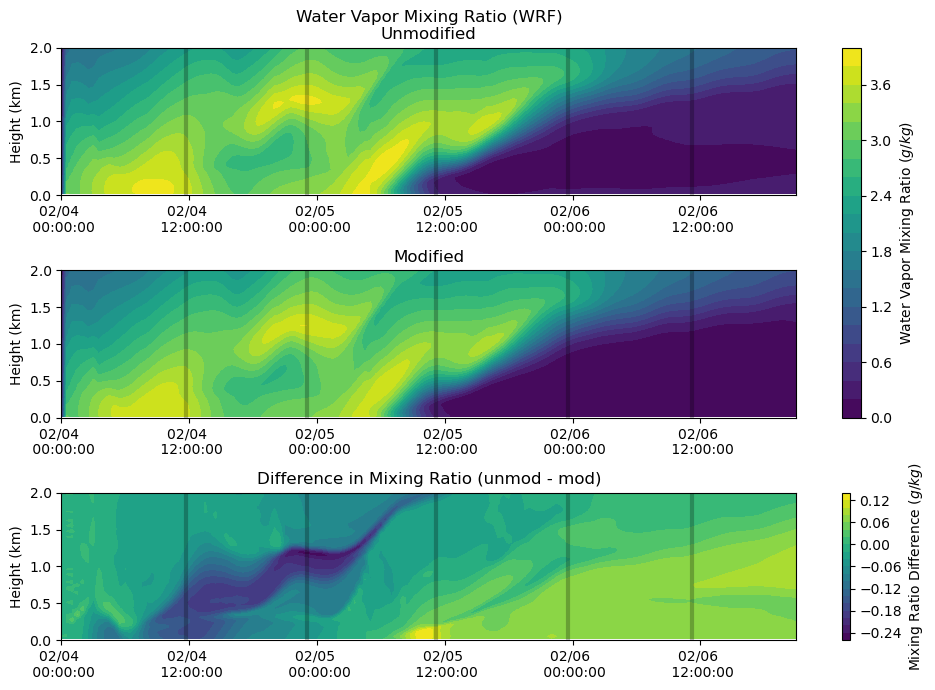
Moisture
fig, axs = plt.subplots(3, figsize=(10,7))

heatmap = axs[0].contourf(qv_df_mod.index, qv_df.columns / 1000, qv_df.T.values[:,:-2] * 1000, levels = 20)
axs[0].set_ylabel('Height (km)')
axs[0].set_title('Water Vapor Mixing Ratio (WRF)\nUnmodified')
axs[0].xaxis.set_major_formatter(myFmt)
axs[0].set_ylim(0,2)
axs[0].vlines(sounding_ws[sdate:'2015-02-06'].index, 0, 2, color = 'k', alpha = 0.25, lw = 3)

heatmap = axs[1].contourf(qv_df_mod.index, qv_df_mod.columns / 1000, qv_df_mod.T.values * 1000, levels = 20)
axs[1].set_ylabel('Height (km)')
axs[1].set_title('Modified')
axs[1].xaxis.set_major_formatter(myFmt)
axs[1].set_ylim(0,2)
axs[1].vlines(sounding_ws[sdate:'2015-02-06'].index, 0, 2, color = 'k', alpha = 0.25, lw = 3)

heatmap_1 = axs[2].contourf(qv_df_mod.index, qv_df.columns / 1000,
                            (qv_df.T.values[:,:-2] * 1000) - (qv_df_mod.T.values * 1000), levels = 20)
axs[2].set_ylabel('Height (km)')
axs[2].set_title('Difference in Mixing Ratio (unmod - mod)')
axs[2].xaxis.set_major_formatter(myFmt)
axs[2].set_ylim(0,2)
axs[2].vlines(sounding_ws[sdate:'2015-02-06'].index, 0, 2, color = 'k', alpha = 0.25, lw = 3)

plt.tight_layout()
cbar = fig.colorbar(heatmap, ax=axs[0:2])
cbar.set_label('Water Vapor Mixing Ratio ($g/kg$)')

cbar = fig.colorbar(heatmap_1, ax=axs[2])
cbar.set_label('Mixing Ratio Difference ($g/kg$)')

plt.show()
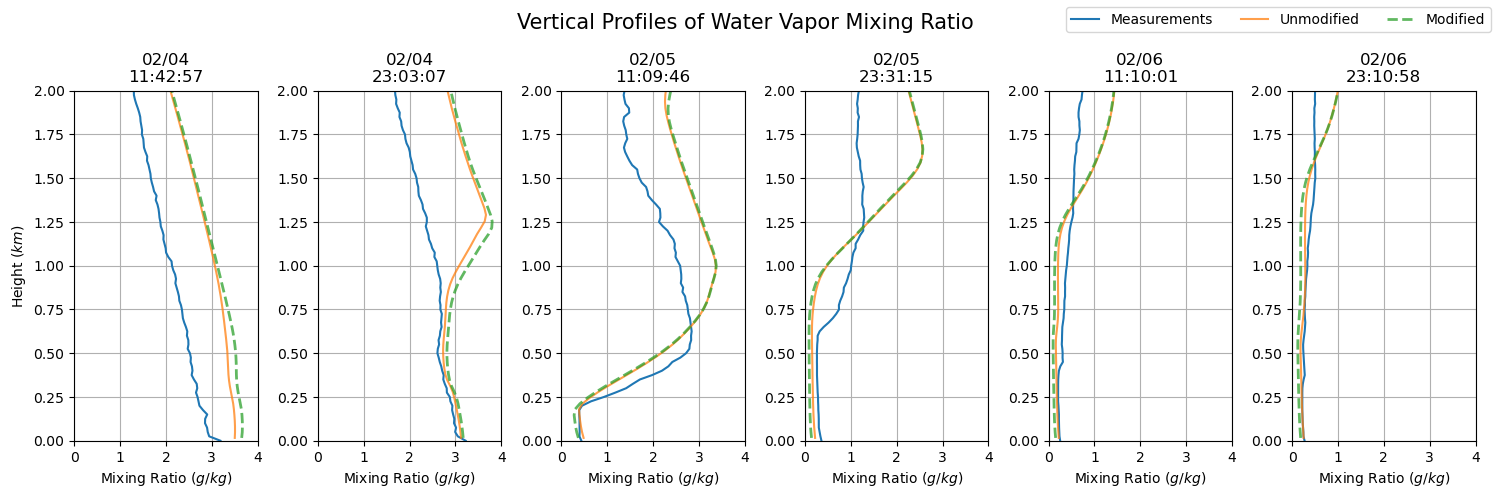
dates = sfc_mixing_ratio[sdate:'2015-02-06'].index
fig, axs = plt.subplots(ncols = len(dates), figsize=(15,5))

for i in np.arange(0, len(dates), 1):
    prof = axs[i].plot(sfc_mixing_ratio.loc[dates[i].to_pydatetime()],
                       sfc_mixing_ratio.loc[dates[i].to_pydatetime()].index.astype(float) / 1000,
                       label = 'Measurements')
    axs[i].set_ylim(0, 2)
    axs[i].grid()
    axs[i].set_xlim(0, 4)
    axs[i].set_xlabel('Mixing Ratio ($g/kg$)')
    axs[i].set_title(dates[i].strftime('%m/%d') + '\n' + dates[i].strftime('%H:%M:%S'))

    axs[i].plot(qv_df.iloc[qv_df.index.get_loc(dates[i].to_pydatetime(), method = 'nearest')] * 1000,
                qv_df.iloc[qv_df.index.get_loc(dates[i].to_pydatetime(), method = 'nearest')].index / 1000,
                label = 'Unmodified', alpha = 0.75)
    axs[i].plot(qv_df_mod.iloc[qv_df_mod.index.get_loc(dates[i].to_pydatetime(), method = 'nearest')] * 1000,
                qv_df_mod.iloc[qv_df_mod.index.get_loc(dates[i].to_pydatetime(), method = 'nearest')].index / 1000,
                '--', label = 'Modified', alpha = 0.75, lw = 2)

axs[0].set_ylabel('Height ($km$)')
plt.suptitle('Vertical Profiles of Water Vapor Mixing Ratio', fontsize = 15)
plt.tight_layout()

handles, labels = axs[0].get_legend_handles_labels()
fig.legend(handles, labels, loc='upper right', ncol = 3)

plt.show()
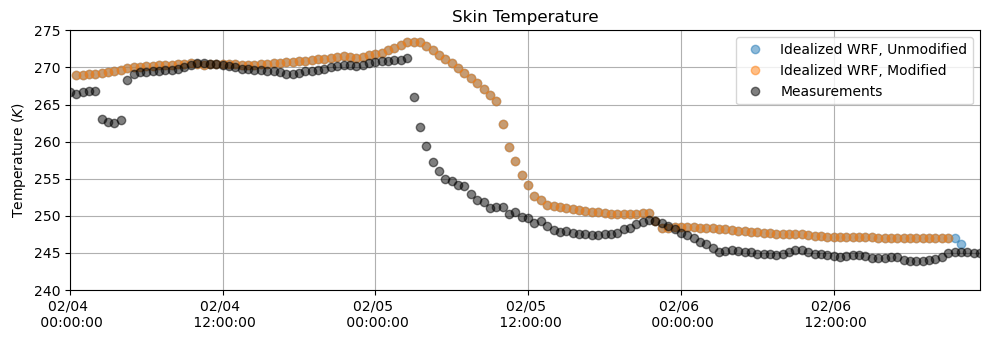
Skin Temperature
plt.figure(figsize = (10,3.5))

plt.plot(tsk_df, 'o', alpha = 0.5)
plt.plot(tsk_df_mod, 'o', alpha = 0.5)
plt.plot(T_meas[sdate:edate].resample('30min').first(), 'o', alpha = 0.5, color = 'k')
plt.ylabel('Temperature $(K)$')
plt.title('Skin Temperature')
plt.grid()
plt.legend(['Idealized WRF, Unmodified', 'Idealized WRF, Modified', 'Measurements'])
plt.ylim(240,275)
plt.xlim(M_downlw[sdate:edate].index[0],M_downlw[sdate:edate].index[-1])
plt.gca().xaxis.set_major_formatter(myFmt)
plt.tight_layout()
plt.show()
Summary Table
Red highlighting indicates the lowest correlation of that variable, green indicates the highest.
edate = '2015-02-06 21:00:00'
lwdns = M_downlw[sdate:edate]
lwdns.columns = ['measured']
lwdns['unmodified'] = lwdnb_df[sdate:edate]
lwdns['modified'] = lwdnb_df_mod[sdate:edate]

lwups = M_uplw[sdate:edate]
lwups.columns = ['measured']
lwups['unmodified'] = lwupb_df[sdate:edate]
lwups['modified'] = lwupb_df_mod[sdate:edate]

swdns = M_downsw[sdate:edate]
swdns.columns = ['measured']
swdns['unmodified'] = swdnb_df[sdate:edate]
swdns['modified'] = swdnb_df_mod[sdate:edate]

swups = M_upsw[sdate:edate]
swups.columns = ['measured']
swups['unmodified'] = swupb_df[sdate:edate]
swups['modified'] = swupb_df_mod[sdate:edate]

lhs = M_lat[sdate:edate]
lhs.columns = ['measured']
lhs['unmodified'] = lh_df[sdate:edate]
lhs['modified'] = lh_df_mod[sdate:edate]

shs = M_sen[sdate:edate]
shs.columns = ['measured']
shs['unmodified'] = sh_df[sdate:edate]
shs['modified'] = sh_df_mod[sdate:edate]
correlation_coefficients = pd.DataFrame([lhs.corr()['measured'].values,
                                         shs.corr()['measured'].values,
                                         lwdns.corr()['measured'].values,
                                         lwups.corr()['measured'].values],
                                         columns = lhs.corr().columns,
                                         index = ['Latent', 'Sensible', 'Downwelling Longwave', 'Upwelling Longwave']).T
cc_1 = correlation_coefficients
r_squared = correlation_coefficients ** 2
rs_1 = r_squared
r_squared[1:].style.highlight_max(color = 'lightgreen', axis = 0).highlight_min(color = 'pink', axis = 0)
| Latent | Sensible | Downwelling Longwave | Upwelling Longwave | |
|---|---|---|---|---|
| unmodified | 0.003053 | 0.031668 | 0.712964 | 0.609335 |
| modified | 0.000586 | 0.051439 | 0.744958 | 0.609335 |
Case 2 - Spring Cloudy
fns = glob('/Volumes/seagate_desktop/idealized/case4/000101/wrfo*')
wrflist = list()
for fn in fns:
    wrflist.append(Dataset(fn))

sdate = '2015-05-02'
edate = '2015-05-04'

sebmask = (M_downlw.index > sdate) & (M_downlw.index < edate)

#cldfra = getvar(wrflist, "CLDFRA", timeidx=ALL_TIMES, method="cat").mean('south_north').mean('west_east')
z = getvar(wrflist, "z").mean('south_north').mean('west_east')
#cldfra_df = pd.DataFrame(cldfra.values, index = cldfra.Time.values, columns = z)

lh = getvar(wrflist, "LH", timeidx=ALL_TIMES, method="cat").mean('south_north').mean('west_east')
lh_df = pd.DataFrame(lh.values, index = lh.Time.values)

sh = getvar(wrflist, "HFX", timeidx=ALL_TIMES, method="cat").mean('south_north').mean('west_east')
sh_df = pd.DataFrame(sh.values, index = sh.Time.values)

lwdnb = getvar(wrflist, "LWDNB", timeidx=ALL_TIMES, method="cat").mean('south_north').mean('west_east')
lwdnb_df = pd.DataFrame(lwdnb.values, index = lwdnb.Time.values)

lwupb = getvar(wrflist, "LWUPB", timeidx=ALL_TIMES, method="cat").mean('south_north').mean('west_east')
lwupb_df = pd.DataFrame(lwupb.values, index = lwupb.Time.values)

swdnb = getvar(wrflist, "SWDNB", timeidx=ALL_TIMES, method="cat").mean('south_north').mean('west_east')
swdnb_df = pd.DataFrame(swdnb.values, index = swdnb.Time.values)

swupb = getvar(wrflist, "SWUPB", timeidx=ALL_TIMES, method="cat").mean('south_north').mean('west_east')
swupb_df = pd.DataFrame(swupb.values, index = swupb.Time.values)

# Finding all wrfout file
fns = glob('/Volumes/seagate_desktop/idealized/landusetbl_modifications/2CloudySpring_000101/wrfo*')

# Creating an empty list to append to
wrflist = list()

# Opening the wrfout files and appending them to the empty list
for fn in fns:
    wrflist.append(Dataset(fn))

#cldfra_mod = getvar(wrflist, "CLDFRA", timeidx=ALL_TIMES, method="cat").mean('south_north').mean('west_east')
z_mod = getvar(wrflist, "z").mean('south_north').mean('west_east')
#cldfra_df_mod = pd.DataFrame(cldfra_mod.values, index = cldfra_mod.Time.values, columns = z_mod)

## lh - latent heat flux
lh_mod = getvar(wrflist, "LH", timeidx=ALL_TIMES, method="cat").mean('south_north').mean('west_east')
lh_df_mod = pd.DataFrame(lh_mod.values, index = lh_mod.Time.values)

## sh - sensible heat flux
sh_mod = getvar(wrflist, "HFX", timeidx=ALL_TIMES, method="cat").mean('south_north').mean('west_east')
sh_df_mod = pd.DataFrame(sh_mod.values, index = sh_mod.Time.values)

## lwdnb - downwelling longwave radiation
lwdnb_mod = getvar(wrflist, "LWDNB", timeidx=ALL_TIMES, method="cat").mean('south_north').mean('west_east')
lwdnb_df_mod = pd.DataFrame(lwdnb_mod.values, index = lwdnb_mod.Time.values)

## lwupb - upwelling longwave radiation
lwupb_mod = getvar(wrflist, "LWUPB", timeidx=ALL_TIMES, method="cat").mean('south_north').mean('west_east')
lwupb_df_mod = pd.DataFrame(lwupb_mod.values, index = lwupb_mod.Time.values)

## swdnb - downwelling shortwave radiation
swdnb_mod = getvar(wrflist, "SWDNB", timeidx=ALL_TIMES, method="cat").mean('south_north').mean('west_east')
swdnb_df_mod = pd.DataFrame(swdnb_mod.values, index = swdnb_mod.Time.values)

## swupb - upwelling shortwave radiation
swupb_mod = getvar(wrflist, "SWUPB", timeidx=ALL_TIMES, method="cat").mean('south_north').mean('west_east')
swupb_df_mod = pd.DataFrame(swupb_mod.values, index = swupb_mod.Time.values)
wrfstat = xr.open_dataset('/Volumes/seagate_desktop/idealized/case4/000101/wrfstat_d01_2015-05-02_00:00:00')
cst_qc = wrfstat['CSP_QC']
cst_tsk = wrfstat['CST_TSK']
cst_sh = wrfstat['CST_SH']
cst_lh = wrfstat['CST_LH']
cst_time = wrfstat['Times']
csp_z = wrfstat['CSP_Z']
csp_u = wrfstat['CSP_U']
csp_v = wrfstat['CSP_V']
csv_qv = wrfstat["CSP_QV"]
qc = pd.DataFrame(cst_qc.values,
                  index = pd.date_range(start='5/2/2015 00:00:00', end='5/4/2015 19:30:00', freq = '30min'),
                  columns = csp_z.isel(Time = 1).values)
sh_df = pd.DataFrame(cst_sh.values,
                  index = pd.date_range(start='5/2/2015 00:00:00', end='5/4/2015 19:30:00', freq = '30min'), columns = ['sh'])
lh_df = pd.DataFrame(cst_lh.values,
                  index = pd.date_range(start='5/2/2015 00:00:00', end='5/4/2015 19:30:00', freq = '30min'), columns = ['lh'])
tsk_df = pd.DataFrame(cst_tsk.values,
                  index = pd.date_range(start='5/2/2015 00:00:00', end='5/4/2015 19:30:00', freq = '30min'), columns = ['tsk'])
u_df = pd.DataFrame(csp_u.values,
                  index = pd.date_range(start='5/2/2015 00:00:00', end='5/4/2015 19:30:00', freq = '30min'),
                  columns = csp_z.isel(Time = 1).values)
v_df = pd.DataFrame(csp_v.values,
                  index = pd.date_range(start='5/2/2015 00:00:00', end='5/4/2015 19:30:00', freq = '30min'),
                  columns = csp_z.isel(Time = 1).values)
ws_df = np.sqrt(v_df**2 + u_df**2)
qv_df = pd.DataFrame(csv_qv.values,
                  index = pd.date_range(start='5/2/2015 00:00:00', end='5/4/2015 19:30:00', freq = '30min'),
                  columns = csp_z.isel(Time = 1).values)

cloudmask = wrfstat['CSV_CLDFRAC'].isel(south_north = round(len(wrfstat.south_north) / 2), west_east = round(len(wrfstat.west_east) / 2))
cloudmask_df = pd.DataFrame(cloudmask.values,
                  index = pd.date_range(start='5/2/2015 00:00:00', end='5/4/2015 19:30:00', freq = '30min'),
                  columns = csp_z.isel(Time = 1).values)

wrfstat = xr.open_dataset('/Volumes/seagate_desktop/idealized/landusetbl_modifications/2CloudySpring_000101/wrfstat_d01_2015-05-02_00:00:00')
cst_qc = wrfstat['CSP_QC']
cst_tsk = wrfstat['CST_TSK']
cst_sh = wrfstat['CST_SH']
cst_lh = wrfstat['CST_LH']
cst_time = wrfstat['Times']
csp_z = wrfstat['CSP_Z']
csp_u = wrfstat['CSP_U']
csp_v = wrfstat['CSP_V']
csv_qv = wrfstat["CSP_QV"]
qc_mod = pd.DataFrame(cst_qc.values,
                  index = pd.date_range(start='5/2/2015 00:00:00', end='5/4/2015 22:30:00', freq = '30min'),
                  columns = csp_z.isel(Time = 1).values)
sh_df_mod = pd.DataFrame(cst_sh.values,
                  index = pd.date_range(start='5/2/2015 00:00:00', end='5/4/2015 22:30:00', freq = '30min'), columns = ['sh'])
lh_df_mod = pd.DataFrame(cst_lh.values,
                  index = pd.date_range(start='5/2/2015 00:00:00', end='5/4/2015 22:30:00', freq = '30min'), columns = ['lh'])
tsk_df_mod = pd.DataFrame(cst_tsk.values,
                  index = pd.date_range(start='5/2/2015 00:00:00', end='5/4/2015 22:30:00', freq = '30min'), columns = ['tsk'])
u_df_mod = pd.DataFrame(csp_u.values,
                  index = pd.date_range(start='5/2/2015 00:00:00', end='5/4/2015 22:30:00', freq = '30min'),
                  columns = csp_z.isel(Time = 1).values)
v_df_mod = pd.DataFrame(csp_v.values,
                  index = pd.date_range(start='5/2/2015 00:00:00', end='5/4/2015 22:30:00', freq = '30min'),
                  columns = csp_z.isel(Time = 1).values)
ws_df_mod = np.sqrt(v_df_mod**2 + u_df_mod**2)
qv_df_mod = pd.DataFrame(csv_qv.values,
                  index = pd.date_range(start='5/2/2015 00:00:00', end='5/4/2015 22:30:00', freq = '30min'),
                  columns = csp_z.isel(Time = 1).values)

cloudmask = wrfstat['CSV_CLDFRAC'].isel(south_north = round(len(wrfstat.south_north) / 2), west_east = round(len(wrfstat.west_east) / 2))
cloudmask_df_mod = pd.DataFrame(cloudmask.values,
                  index = pd.date_range(start='5/2/2015 00:00:00', end='5/4/2015 22:30:00', freq = '30min'),
                  columns = csp_z.isel(Time = 1).values)
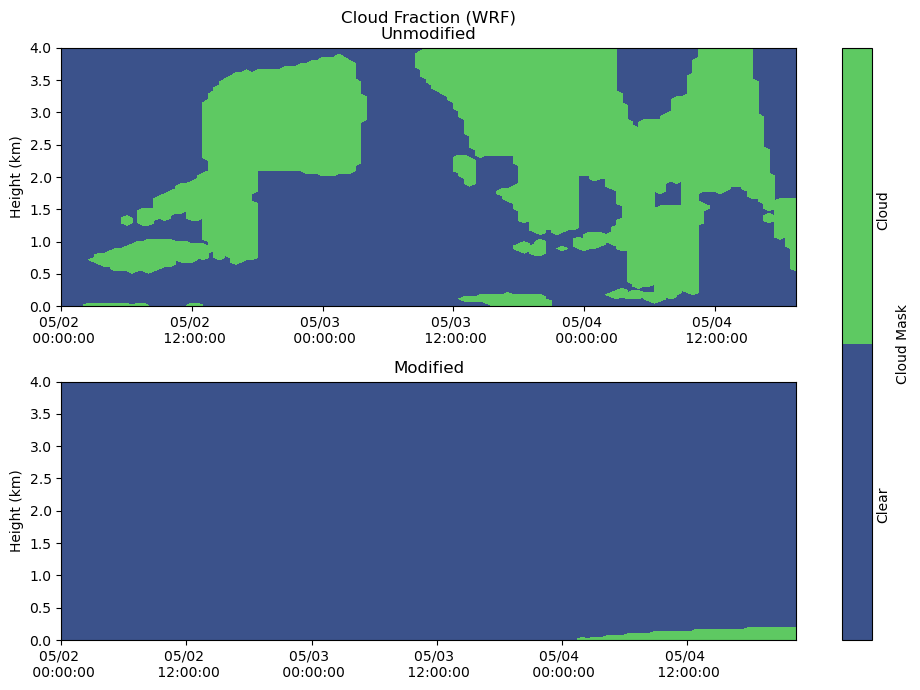
Clouds
fig, axs = plt.subplots(2, figsize=(10,7))

heatmap = axs[0].contourf(cloudmask_df.index, cloudmask_df.columns / 1000, cloudmask_df.T.values, levels = [-1, 0, 1])
axs[0].set_ylabel('Height (km)')
axs[0].set_title('Cloud Fraction (WRF)\nUnmodified')
axs[0].xaxis.set_major_formatter(myFmt)
axs[0].set_ylim(0,4)

heatmap = axs[1].contourf(cloudmask_df_mod.index, cloudmask_df_mod.columns / 1000, cloudmask_df_mod.T, levels = [-1, 0, 1])
axs[1].set_ylabel('Height (km)')
axs[1].set_title('Modified')
axs[1].xaxis.set_major_formatter(myFmt)
axs[1].set_ylim(0,4)
plt.tight_layout()

cbar = fig.colorbar(heatmap, ax=axs[:], ticks = [-0.5, 0.5], label = "Cloud Mask")
cbar.ax.set_yticklabels(['Clear','Cloud'], rotation = 90)
cbar.ax.tick_params(size=0)
plt.show()
fns = ['/Volumes/seagate_desktop/data/MPL/Robert_MPLData/FinalNICELidarData/NICE_MPLDataFinal20150502.cdf',
'/Volumes/seagate_desktop/data/MPL/Robert_MPLData/FinalNICELidarData/NICE_MPLDataFinal20150503.cdf',
'/Volumes/seagate_desktop/data/MPL/Robert_MPLData/FinalNICELidarData/NICE_MPLDataFinal20150504.cdf']
measured_cloudmask_all = pd.DataFrame()
for fn in fns:
rbt_cldmask = xr.open_dataset(fn)
# Time is in UTC time stamp in fractional hours
Time = rbt_cldmask.variables['DataTime'].values
# Fix time to be a timestamp - Currently in hours
yy = 2015
mm = int(fn[-8:-6])
dd = int(fn[-6:-4])
date = [datetime(yy,mm,dd) + timedelta(seconds=hr*3600) for hr in Time[~np.isnan(Time)]]
measured_cloudmask = pd.DataFrame(rbt_cldmask['PhaseMask'][~np.isnan(Time)].values, index = date, columns = rbt_cldmask['Range'])
measured_cloudmask_all = pd.concat([measured_cloudmask_all, measured_cloudmask])
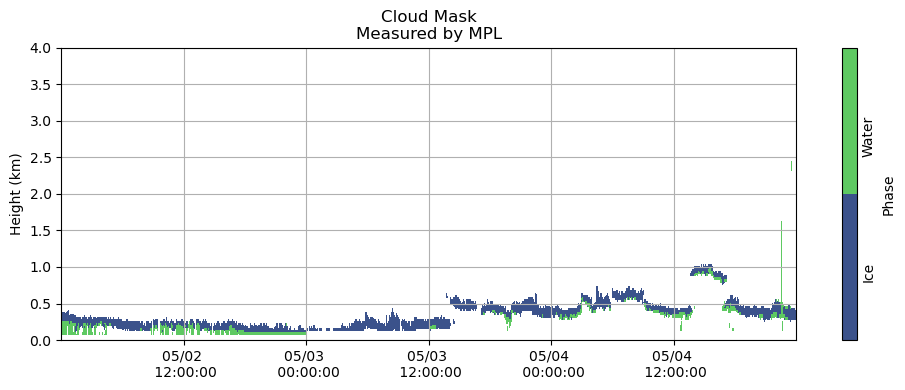
fig, ax = plt.subplots(figsize=(10,4))
plt.grid()
heatmap = plt.contourf(measured_cloudmask_all.index,
measured_cloudmask_all.columns / 1000,
measured_cloudmask_all.T.values,
[0, 1, 2])
# nan - no information
# 1 - cloud liquid
# 2 - cloud ice
plt.title('Cloud Mask\nMeasured by MPL')
plt.ylabel('Height (km)')
cbar = fig.colorbar(heatmap, label = 'Phase', ticks = [0.5, 1.5], orientation = 'vertical')
cbar.ax.set_yticklabels(['Ice', 'Water'], rotation = 90)
cbar.ax.tick_params(size=0)
plt.gca().xaxis.set_major_formatter(myFmt)
plt.ylim(0, 4)
plt.tight_layout()
plt.show()
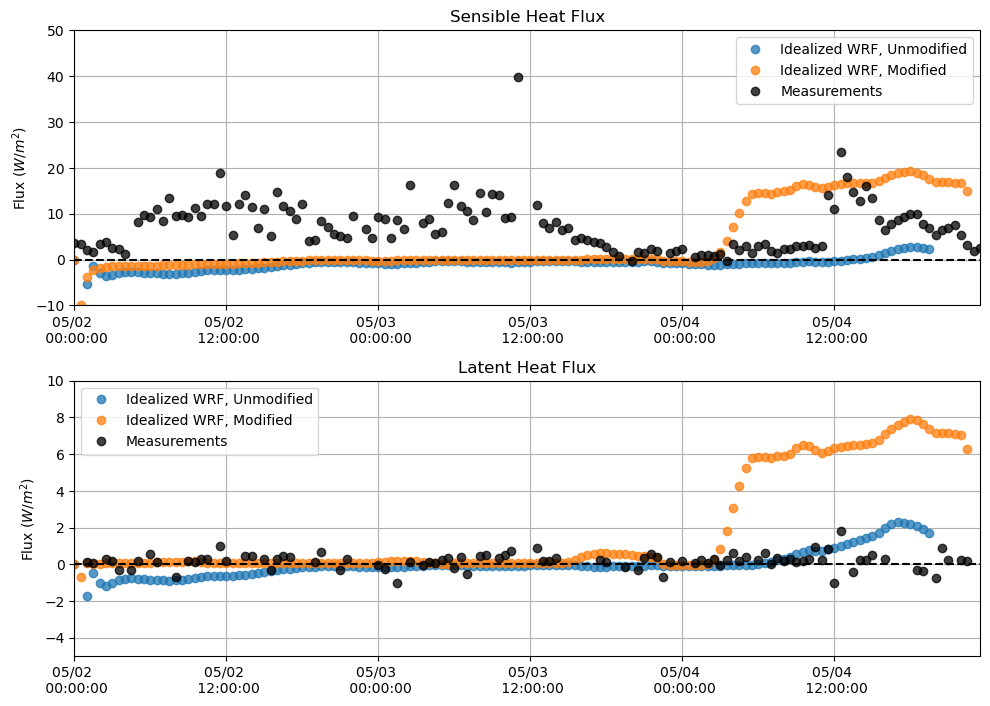
Sensible and Latent Heat Flux
plt.figure(figsize = (10,7))
plt.subplot(211)
plt.plot(sh_df, 'o', alpha = 0.75)
plt.plot(sh_df_mod, 'o', alpha = 0.75)
plt.plot(M_sen[sdate:edate], 'o', alpha = 0.75, color = 'k')
plt.hlines(0, xmin = M_lat[sdate:edate].index[0], xmax = M_lat[sdate:edate].index[-1], linestyle = '--', color = 'k')
plt.ylabel('Flux $(W/m^{2})$')
plt.title('Sensible Heat Flux')
plt.grid()
plt.legend(['Idealized WRF, Unmodified', 'Idealized WRF, Modified', 'Measurements'])
plt.ylim(-10,50)
plt.xlim(M_lat[sdate:edate].index[0],M_lat[sdate:edate].index[-1])
plt.gca().xaxis.set_major_formatter(myFmt)

plt.subplot(212)
plt.plot(lh_df, 'o', alpha = 0.75)
plt.plot(lh_df_mod, 'o', alpha = 0.75)
plt.plot(M_lat[sdate:edate], 'o', alpha = 0.75, color = 'k')
plt.hlines(0, xmin = M_lat[sdate:edate].index[0], xmax = M_lat[sdate:edate].index[-1], linestyle = '--', color = 'k')
plt.ylabel('Flux $(W/m^{2})$')
plt.title('Latent Heat Flux')
plt.grid()
plt.ylim(-5,10)
plt.legend(['Idealized WRF, Unmodified', 'Idealized WRF, Modified', 'Measurements'])
plt.xlim(M_lat[sdate:edate].index[0],M_lat[sdate:edate].index[-1])
plt.tight_layout()
plt.gca().xaxis.set_major_formatter(myFmt)
plt.show()
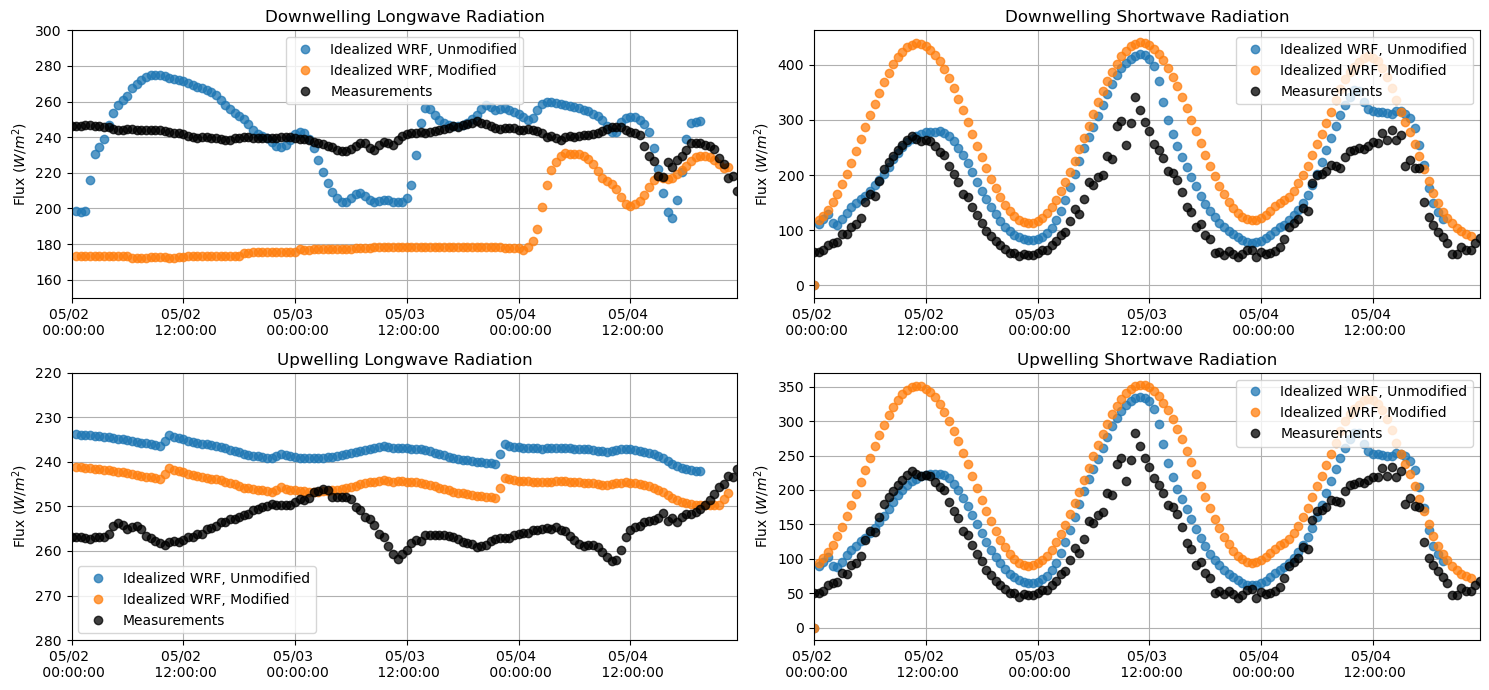
Longwave and Shortwave Radiation
plt.figure(figsize = (15,7))
plt.subplot(221)
plt.plot(lwdnb_df, 'o', alpha = 0.75)
plt.plot(lwdnb_df_mod, 'o', alpha = 0.75)
plt.plot(M_downlw[sdate:edate], 'o', alpha = 0.75, color = 'k')
plt.ylabel('Flux $(W/m^{2})$')
plt.title('Downwelling Longwave Radiation')
plt.grid()
plt.legend(['Idealized WRF, Unmodified', 'Idealized WRF, Modified', 'Measurements'])
plt.ylim(150,300)
plt.xlim(M_downlw[sdate:edate].index[0],M_downlw[sdate:edate].index[-1])
plt.gca().xaxis.set_major_formatter(myFmt)

plt.subplot(223)
plt.plot(lwupb_df, 'o', alpha = 0.75)
plt.plot(lwupb_df_mod, 'o', alpha = 0.75)
plt.plot(M_uplw[sdate:edate], 'o', alpha = 0.75, color = 'k')
plt.ylabel('Flux $(W/m^{2})$')
plt.title('Upwelling Longwave Radiation')
plt.grid()
plt.ylim(280,220)
plt.legend(['Idealized WRF, Unmodified', 'Idealized WRF, Modified', 'Measurements'])
plt.xlim(M_downlw[sdate:edate].index[0],M_downlw[sdate:edate].index[-1])
plt.gca().xaxis.set_major_formatter(myFmt)

plt.subplot(222)
plt.plot(swdnb_df, 'o', alpha = 0.75)
plt.plot(swdnb_df_mod, 'o', alpha = 0.75)
plt.plot(M_downsw[sdate:edate], 'o', alpha = 0.75, color = 'k')
plt.ylabel('Flux $(W/m^{2})$')
plt.title('Downwelling Shortwave Radiation')
plt.grid()
plt.legend(['Idealized WRF, Unmodified', 'Idealized WRF, Modified', 'Measurements'])
#plt.ylim(180,300)
plt.xlim(M_downlw[sdate:edate].index[0],M_downlw[sdate:edate].index[-1])
plt.gca().xaxis.set_major_formatter(myFmt)

plt.subplot(224)
plt.plot(swupb_df, 'o', alpha = 0.75)
plt.plot(swupb_df_mod, 'o', alpha = 0.75)
plt.plot(M_upsw[sdate:edate], 'o', alpha = 0.75, color = 'k')
plt.ylabel('Flux $(W/m^{2})$')
plt.title('Upwelling Shortwave Radiation')
plt.grid()
#plt.ylim(180, 300)
plt.legend(['Idealized WRF, Unmodified', 'Idealized WRF, Modified', 'Measurements'])
plt.xlim(M_downlw[sdate:edate].index[0],M_downlw[sdate:edate].index[-1])
plt.gca().xaxis.set_major_formatter(myFmt)
plt.tight_layout()
plt.show()
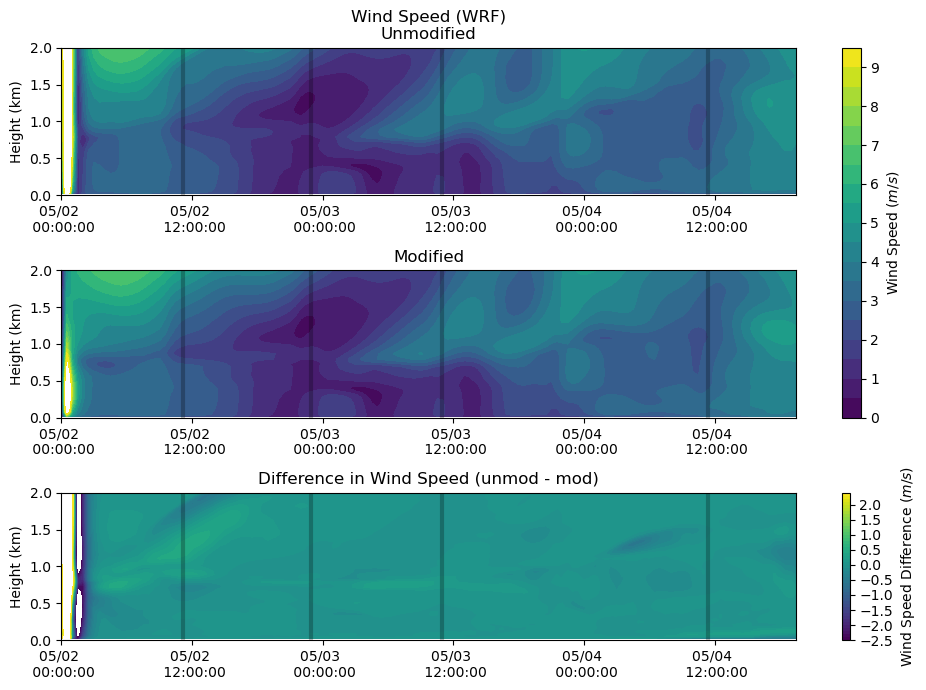
Wind Speed
fig, axs = plt.subplots(3, figsize=(10,7))
levels = np.arange(0,10,0.5)

heatmap = axs[0].contourf(ws_df.index, ws_df.columns / 1000, ws_df.T.values, levels = levels)
axs[0].set_ylabel('Height (km)')
axs[0].set_title('Wind Speed (WRF)\nUnmodified')
axs[0].xaxis.set_major_formatter(myFmt)
axs[0].set_ylim(0,2)
axs[0].vlines(sounding_ws[sdate:'2015-05-04'].index, 0, 2, color = 'k', alpha = 0.25, lw = 3)

heatmap = axs[1].contourf(ws_df.index, ws_df_mod.columns / 1000, ws_df_mod.T.values[:,:-6], levels = levels)
axs[1].set_ylabel('Height (km)')
axs[1].set_title('Modified')
axs[1].xaxis.set_major_formatter(myFmt)
axs[1].set_ylim(0,2)
axs[1].vlines(sounding_ws[sdate:'2015-05-04'].index, 0, 2, color = 'k', alpha = 0.25, lw = 3)

levels = np.arange(-2.5,2.5,0.1)
heatmap_1 = axs[2].contourf(ws_df.index, ws_df.columns / 1000, ws_df.T.values - ws_df_mod.T.values[:,:-6], levels = levels)
axs[2].set_ylabel('Height (km)')
axs[2].set_title('Difference in Wind Speed (unmod - mod)')
axs[2].xaxis.set_major_formatter(myFmt)
axs[2].set_ylim(0,2)
axs[2].vlines(sounding_ws[sdate:'2015-05-04'].index, 0, 2, color = 'k', alpha = 0.25, lw = 3)

plt.tight_layout()
cbar = fig.colorbar(heatmap, ax=axs[0:2])
cbar.set_label('Wind Speed ($m/s$)')

cbar = fig.colorbar(heatmap_1, ax=axs[2])
cbar.set_label('Wind Speed Difference ($m/s$)')

plt.show()
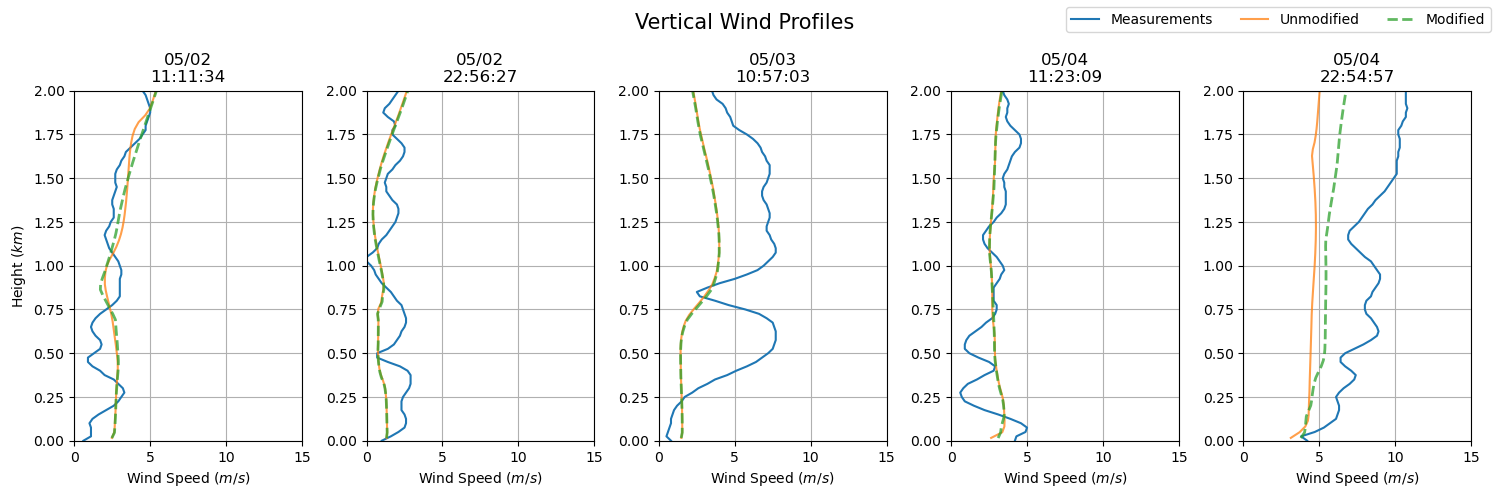
dates = sounding_ws[sdate:'2015-05-04'].index
fig, axs = plt.subplots(ncols = len(dates), figsize=(15,5))

for i in np.arange(0, len(dates), 1):
    prof = axs[i].plot(sounding_ws.loc[dates[i]], sounding_ws.loc[dates[i]].index / 1000, label = 'Measurements')
    axs[i].set_ylim(0, 2)
    axs[i].grid()
    axs[i].set_xlim(0, 15)
    axs[i].set_xlabel('Wind Speed ($m/s$)')
    axs[i].set_title(dates[i].strftime('%m/%d') + '\n' + dates[i].strftime('%H:%M:%S'))

    axs[i].plot(ws_df.iloc[ws_df.index.get_loc(dates[i], method = 'nearest')], ws_df.iloc[ws_df.index.get_loc(dates[0], method = 'nearest')].index / 1000, label = 'Unmodified', alpha = 0.75)
    axs[i].plot(ws_df_mod.iloc[ws_df_mod.index.get_loc(dates[i], method = 'nearest')], ws_df_mod.iloc[ws_df_mod.index.get_loc(dates[0], method = 'nearest')].index / 1000, '--', label = 'Modified', alpha = 0.75, lw = 2)

axs[0].set_ylabel('Height ($km$)')
plt.suptitle('Vertical Wind Profiles', fontsize = 15)
plt.tight_layout()

handles, labels = axs[0].get_legend_handles_labels()
fig.legend(handles, labels, loc='upper right', ncol = 3)

plt.show()
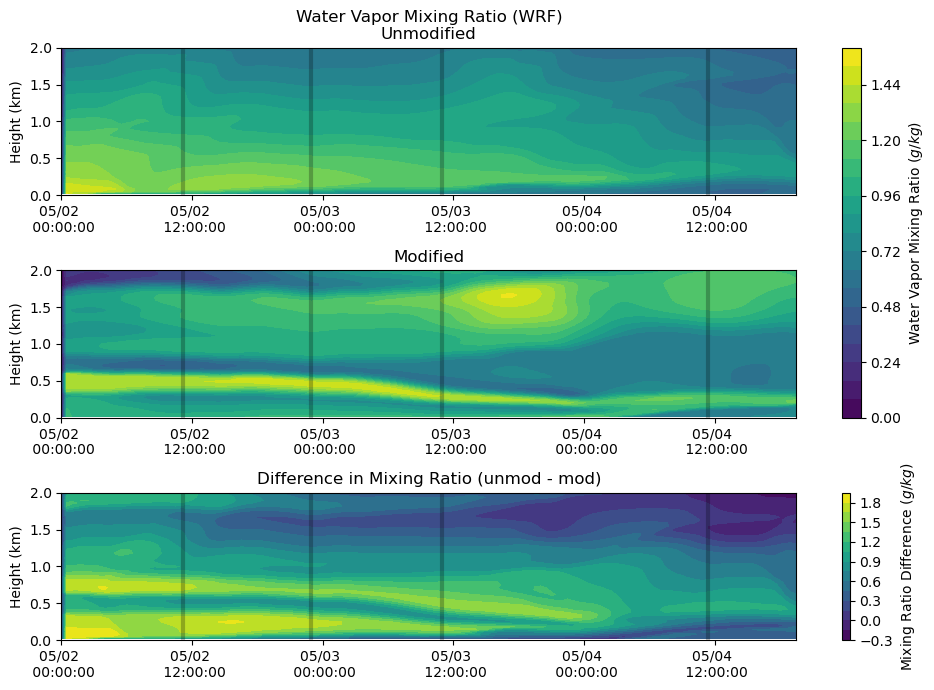
Moisture
fig, axs = plt.subplots(3, figsize=(10,7))

heatmap = axs[0].contourf(qv_df.index, qv_df.columns / 1000, qv_df.T.values * 1000, levels = 20)
axs[0].set_ylabel('Height (km)')
axs[0].set_title('Water Vapor Mixing Ratio (WRF)\nUnmodified')
axs[0].xaxis.set_major_formatter(myFmt)
axs[0].set_ylim(0,2)
axs[0].vlines(sounding_ws[sdate:'2015-05-04'].index, 0, 2, color = 'k', alpha = 0.25, lw = 3)

heatmap = axs[1].contourf(qv_df.index, qv_df_mod.columns / 1000, qv_df_mod.T.values[:,:-6] * 1000, levels = 20)
axs[1].set_ylabel('Height (km)')
axs[1].set_title('Modified')
axs[1].xaxis.set_major_formatter(myFmt)
axs[1].set_ylim(0,2)
axs[1].vlines(sounding_ws[sdate:'2015-05-04'].index, 0, 2, color = 'k', alpha = 0.25, lw = 3)

heatmap_1 = axs[2].contourf(qv_df.index, qv_df.columns / 1000,
                            (qv_df.T.values * 1000) - (qv_df_mod.T.values[:,:-6] * 1000), levels = 20)
axs[2].set_ylabel('Height (km)')
axs[2].set_title('Difference in Mixing Ratio (unmod - mod)')
axs[2].xaxis.set_major_formatter(myFmt)
axs[2].set_ylim(0,2)
axs[2].vlines(sounding_ws[sdate:'2015-05-04'].index, 0, 2, color = 'k', alpha = 0.25, lw = 3)

plt.tight_layout()
cbar = fig.colorbar(heatmap, ax=axs[0:2])
cbar.set_label('Water Vapor Mixing Ratio ($g/kg$)')

cbar = fig.colorbar(heatmap_1, ax=axs[2])
cbar.set_label('Mixing Ratio Difference ($g/kg$)')

plt.show()
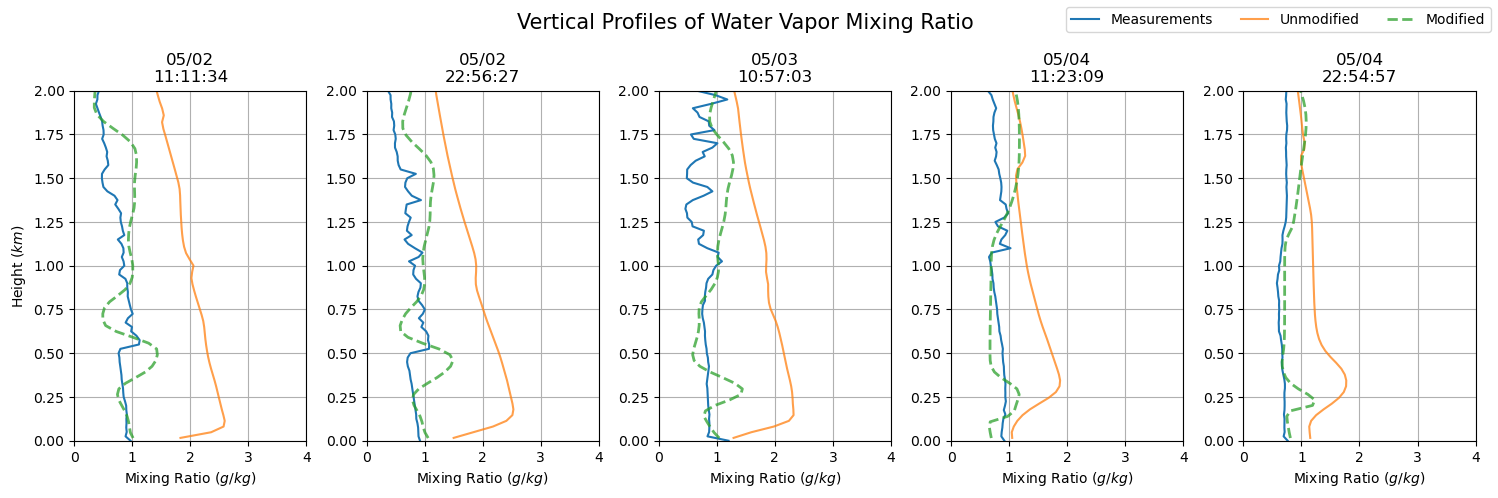
dates = sfc_mixing_ratio[sdate:'2015-05-04'].index
fig, axs = plt.subplots(ncols = len(dates), figsize=(15,5))

for i in np.arange(0, len(dates), 1):
    prof = axs[i].plot(sfc_mixing_ratio.loc[dates[i].to_pydatetime()],
                       sfc_mixing_ratio.loc[dates[i].to_pydatetime()].index.astype(float) / 1000,
                       label = 'Measurements')
    axs[i].set_ylim(0, 2)
    axs[i].grid()
    axs[i].set_xlim(0, 4)
    axs[i].set_xlabel('Mixing Ratio ($g/kg$)')
    axs[i].set_title(dates[i].strftime('%m/%d') + '\n' + dates[i].strftime('%H:%M:%S'))

    axs[i].plot(qv_df.iloc[qv_df.index.get_loc(dates[i].to_pydatetime(), method = 'nearest')] * 1000,
                qv_df.iloc[qv_df.index.get_loc(dates[i].to_pydatetime(), method = 'nearest')].index / 1000,
                label = 'Unmodified', alpha = 0.75)
    axs[i].plot(qv_df_mod.iloc[qv_df_mod.index.get_loc(dates[i].to_pydatetime(), method = 'nearest')] * 1000,
                qv_df_mod.iloc[qv_df_mod.index.get_loc(dates[i].to_pydatetime(), method = 'nearest')].index / 1000,
                '--', label = 'Modified', alpha = 0.75, lw = 2)

axs[0].set_ylabel('Height ($km$)')
plt.suptitle('Vertical Profiles of Water Vapor Mixing Ratio', fontsize = 15)
plt.tight_layout()

handles, labels = axs[0].get_legend_handles_labels()
fig.legend(handles, labels, loc='upper right', ncol = 3)

plt.show()
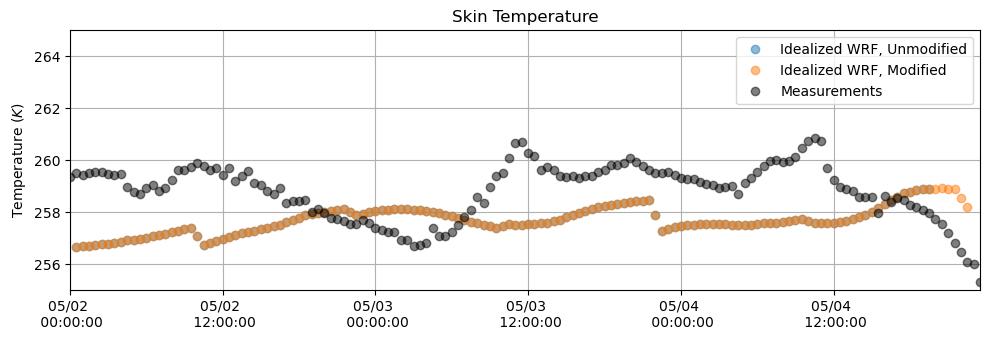
Skin Temperature
plt.figure(figsize = (10,3.5))
plt.plot(tsk_df, 'o', alpha = 0.5)
plt.plot(tsk_df_mod, 'o', alpha = 0.5)
plt.plot(T_meas[sdate:edate].resample('30min').first(), 'o', alpha = 0.5, color = 'k')
plt.ylabel('Temperature $(K)$')
plt.title('Skin Temperature')
plt.grid()
plt.legend(['Idealized WRF, Unmodified', 'Idealized WRF, Modified', 'Measurements'])
plt.ylim(255,265)
plt.xlim(M_downlw[sdate:edate].index[0],M_downlw[sdate:edate].index[-1])
plt.gca().xaxis.set_major_formatter(myFmt)
plt.tight_layout()
plt.show()
Summary Table
Red highlighting indicates the lowest correlation of that variable, green indicates the highest.
edate = '2015-05-04 19:30:00'
lwdns = M_downlw[sdate:edate]
lwdns.columns = ['measured']
lwdns['unmodified'] = lwdnb_df[sdate:edate]
lwdns['modified'] = lwdnb_df_mod[sdate:edate]

lwups = M_uplw[sdate:edate]
lwups.columns = ['measured']
lwups['unmodified'] = lwupb_df[sdate:edate]
lwups['modified'] = lwupb_df_mod[sdate:edate]

swdns = M_downsw[sdate:edate]
swdns.columns = ['measured']
swdns['unmodified'] = swdnb_df[sdate:edate]
swdns['modified'] = swdnb_df_mod[sdate:edate]

swups = M_upsw[sdate:edate]
swups.columns = ['measured']
swups['unmodified'] = swupb_df[sdate:edate]
swups['modified'] = swupb_df_mod[sdate:edate]

lhs = M_lat[sdate:edate]
lhs.columns = ['measured']
lhs['unmodified'] = lh_df[sdate:edate]
lhs['modified'] = lh_df_mod[sdate:edate]

shs = M_sen[sdate:edate]
shs.columns = ['measured']
shs['unmodified'] = sh_df[sdate:edate]
shs['modified'] = sh_df_mod[sdate:edate]
correlation_coefficients = pd.DataFrame([lhs.corr()['measured'].values,
                                         shs.corr()['measured'].values,
                                         lwdns.corr()['measured'].values,
                                         lwups.corr()['measured'].values,
                                         swdns.corr()['measured'].values,
                                         swups.corr()['measured'].values],
                                         columns = lhs.corr().columns,
                                         index = ['Latent', 'Sensible', 'Downwelling Longwave', 'Upwelling Longwave', 'Downwelling Shortwave', 'Upwelling Shortwave']).T
cc_2 = correlation_coefficients
r_squared = correlation_coefficients ** 2
rs_2 = r_squared
r_squared[1:].style.highlight_max(color = 'lightgreen', axis = 0).highlight_min(color = 'pink', axis = 0)
| Latent | Sensible | Downwelling Longwave | Upwelling Longwave | Downwelling Shortwave | Upwelling Shortwave | |
|---|---|---|---|---|---|---|
| unmodified | 0.000645 | 0.004846 | 0.091075 | 0.006432 | 0.885284 | 0.883314 |
| modified | 0.007810 | 0.001159 | 0.108260 | 0.006431 | 0.886173 | 0.895837 |
Case 3 - Spring Clear
sdate = '2015-05-22'
edate = '2015-05-24'

M_net = (M_downlw['lw'] - M_uplw['lw'])
sebmask = (M_downlw.index > sdate) & (M_downlw.index < edate)

fns = glob('/Volumes/seagate_desktop/idealized/case3/000101/wrfo*')
wrflist = list()
for fn in fns:
    wrflist.append(Dataset(fn))

#cldfra = getvar(wrflist, "CLDFRA", timeidx=ALL_TIMES, method="cat").mean('south_north').mean('west_east')
z = getvar(wrflist, "z").mean('south_north').mean('west_east')
#cldfra_df = pd.DataFrame(cldfra.values, index = cldfra.Time.values, columns = z)

lh = getvar(wrflist, "LH", timeidx=ALL_TIMES, method="cat").mean('south_north').mean('west_east')
lh_df = pd.DataFrame(lh.values, index = lh.Time.values)

sh = getvar(wrflist, "HFX", timeidx=ALL_TIMES, method="cat").mean('south_north').mean('west_east')
sh_df = pd.DataFrame(sh.values, index = sh.Time.values)

lwdnb = getvar(wrflist, "LWDNB", timeidx=ALL_TIMES, method="cat").mean('south_north').mean('west_east')
lwdnb_df = pd.DataFrame(lwdnb.values, index = lwdnb.Time.values)

lwupb = getvar(wrflist, "LWUPB", timeidx=ALL_TIMES, method="cat").mean('south_north').mean('west_east')
lwupb_df = pd.DataFrame(lwupb.values, index = lwupb.Time.values)

swdnb = getvar(wrflist, "SWDNB", timeidx=ALL_TIMES, method="cat").mean('south_north').mean('west_east')
swdnb_df = pd.DataFrame(swdnb.values, index = swdnb.Time.values)

swupb = getvar(wrflist, "SWUPB", timeidx=ALL_TIMES, method="cat").mean('south_north').mean('west_east')
swupb_df = pd.DataFrame(swupb.values, index = swupb.Time.values)

# MODIFIED

# Finding all wrfout file
fns = glob('/Volumes/seagate_desktop/idealized/landusetbl_modifications/3ClearSpring_000101/wrfo*')

# Creating an empty list to append to
wrflist = list()

# Opening the wrfout files and appending them to the empty list
for fn in fns:
    wrflist.append(Dataset(fn))

# Importing WRF variables
## dbZ - for cloud plotting
cldfra_mod = getvar(wrflist, "CLDFRA", timeidx=ALL_TIMES, method="cat").mean('south_north').mean('west_east')
z_mod = getvar(wrflist, "z").mean('south_north').mean('west_east')
cldfra_df_mod = pd.DataFrame(cldfra_mod.values, index = cldfra_mod.Time.values, columns = z_mod)

## lh - latent heat flux
lh_mod = getvar(wrflist, "LH", timeidx=ALL_TIMES, method="cat").mean('south_north').mean('west_east')
lh_df_mod = pd.DataFrame(lh_mod.values, index = lh_mod.Time.values)

## sh - sensible heat flux
sh_mod = getvar(wrflist, "HFX", timeidx=ALL_TIMES, method="cat").mean('south_north').mean('west_east')
sh_df_mod = pd.DataFrame(sh_mod.values, index = sh_mod.Time.values)

## lwdnb - downwelling longwave radiation
lwdnb_mod = getvar(wrflist, "LWDNB", timeidx=ALL_TIMES, method="cat").mean('south_north').mean('west_east')
lwdnb_df_mod = pd.DataFrame(lwdnb_mod.values, index = lwdnb_mod.Time.values)

## lwupb - upwelling longwave radiation
lwupb_mod = getvar(wrflist, "LWUPB", timeidx=ALL_TIMES, method="cat").mean('south_north').mean('west_east')
lwupb_df_mod = pd.DataFrame(lwupb_mod.values, index = lwupb_mod.Time.values)

## swdnb - downwelling shortwave radiation
swdnb_mod = getvar(wrflist, "SWDNB", timeidx=ALL_TIMES, method="cat").mean('south_north').mean('west_east')
swdnb_df_mod = pd.DataFrame(swdnb_mod.values, index = swdnb_mod.Time.values)

## swupb - upwelling shortwave radiation
swupb_mod = getvar(wrflist, "SWUPB", timeidx=ALL_TIMES, method="cat").mean('south_north').mean('west_east')
swupb_df_mod = pd.DataFrame(swupb_mod.values, index = swupb_mod.Time.values)
wrfstat = xr.open_dataset('/Volumes/seagate_desktop/idealized/case3/000101/second_try/wrfstat_d01_2015-05-22_00:00:00')
cst_qc = wrfstat['CSP_QC']
cst_tsk = wrfstat['CST_TSK']
cst_sh = wrfstat['CST_SH']
cst_lh = wrfstat['CST_LH']
cst_time = wrfstat['Times']
csp_z = wrfstat['CSP_Z']
csp_u = wrfstat['CSP_U']
csp_v = wrfstat['CSP_V']
csv_qv = wrfstat["CSP_QV"]
qc = pd.DataFrame(cst_qc.values,
                  index = pd.date_range(start='5/22/2015 00:00:00', end='5/24/2015 22:30:00', freq = '30min'),
                  columns = csp_z.isel(Time = 1).values)
sh_df = pd.DataFrame(cst_sh.values,
                  index = pd.date_range(start='5/22/2015 00:00:00', end='5/24/2015 22:30:00', freq = '30min'), columns = ['sh'])
lh_df = pd.DataFrame(cst_lh.values,
                  index = pd.date_range(start='5/22/2015 00:00:00', end='5/24/2015 22:30:00', freq = '30min'), columns = ['lh'])
tsk_df = pd.DataFrame(cst_tsk.values,
                  index = pd.date_range(start='5/22/2015 00:00:00', end='5/24/2015 22:30:00', freq = '30min'), columns = ['tsk'])
u_df = pd.DataFrame(csp_u.values,
                  index = pd.date_range(start='5/22/2015 00:00:00', end='5/24/2015 22:30:00', freq = '30min'),
                  columns = csp_z.isel(Time = 1).values)
v_df = pd.DataFrame(csp_v.values,
                  index = pd.date_range(start='5/22/2015 00:00:00', end='5/24/2015 22:30:00', freq = '30min'),
                  columns = csp_z.isel(Time = 1).values)
ws_df = np.sqrt(v_df**2 + u_df**2)
qv_df = pd.DataFrame(csv_qv.values,
                  index = pd.date_range(start='5/22/2015 00:00:00', end='5/24/2015 22:30:00', freq = '30min'),
                  columns = csp_z.isel(Time = 1).values)

cloudmask = wrfstat['CSV_CLDFRAC'].isel(south_north = round(len(wrfstat.south_north) / 2), west_east = round(len(wrfstat.west_east) / 2))
cloudmask_df = pd.DataFrame(cloudmask.values,
                  index = pd.date_range(start='5/22/2015 00:00:00', end='5/24/2015 22:30:00', freq = '30min'),
                  columns = csp_z.isel(Time = 1).values)


wrfstat = xr.open_dataset('/Volumes/seagate_desktop/idealized/landusetbl_modifications/3ClearSpring_000101/corrected_input/wrfstat_d01_2015-05-22_00:00:00')
cst_qc = wrfstat['CSP_QC']
cst_tsk = wrfstat['CST_TSK']
cst_sh = wrfstat['CST_SH']
cst_lh = wrfstat['CST_LH']
cst_time = wrfstat['Times']
csp_z = wrfstat['CSP_Z']
csp_u = wrfstat['CSP_U']
csp_v = wrfstat['CSP_V']
csv_qv = wrfstat["CSP_QV"]
qc_mod = pd.DataFrame(cst_qc.values,
                  index = pd.date_range(start='5/22/2015 00:00:00', end='5/24/2015 22:30:00', freq = '30min'),
                  columns = csp_z.isel(Time = 1).values)
sh_df_mod = pd.DataFrame(cst_sh.values,
                  index = pd.date_range(start='5/22/2015 00:00:00', end='5/24/2015 22:30:00', freq = '30min'), columns = ['sh'])
lh_df_mod = pd.DataFrame(cst_lh.values,
                  index = pd.date_range(start='5/22/2015 00:00:00', end='5/24/2015 22:30:00', freq = '30min'), columns = ['lh'])
tsk_df_mod = pd.DataFrame(cst_tsk.values,
                  index = pd.date_range(start='5/22/2015 00:00:00', end='5/24/2015 22:30:00', freq = '30min'), columns = ['tsk'])
u_df_mod = pd.DataFrame(csp_u.values,
                  index = pd.date_range(start='5/22/2015 00:00:00', end='5/24/2015 22:30:00', freq = '30min'),
                  columns = csp_z.isel(Time = 1).values)
v_df_mod = pd.DataFrame(csp_v.values,
                  index = pd.date_range(start='5/22/2015 00:00:00', end='5/24/2015 22:30:00', freq = '30min'),
                  columns = csp_z.isel(Time = 1).values)
ws_df_mod = np.sqrt(v_df_mod**2 + u_df_mod**2)
qv_df_mod = pd.DataFrame(csv_qv.values,
                  index = pd.date_range(start='5/22/2015 00:00:00', end='5/24/2015 22:30:00', freq = '30min'),
                  columns = csp_z.isel(Time = 1).values)

cloudmask = wrfstat['CSV_CLDFRAC'].isel(south_north = round(len(wrfstat.south_north) / 2), west_east = round(len(wrfstat.west_east) / 2))
cloudmask_df_mod = pd.DataFrame(cloudmask.values,
                  index = pd.date_range(start='5/22/2015 00:00:00', end='5/24/2015 22:30:00', freq = '30min'),
                  columns = csp_z.isel(Time = 1).values)
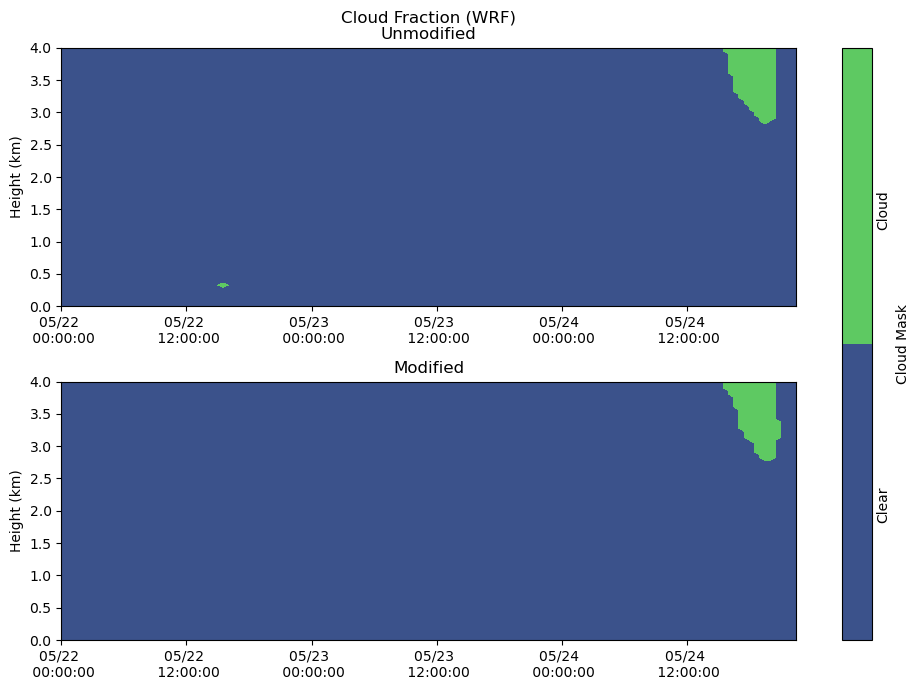
Clouds
fig, axs = plt.subplots(2, figsize=(10,7))

heatmap = axs[0].contourf(cloudmask_df.index, cloudmask_df.columns / 1000, cloudmask_df.T.values, levels = [-1, 0, 1])
axs[0].set_ylabel('Height (km)')
axs[0].set_title('Cloud Fraction (WRF)\nUnmodified')
axs[0].xaxis.set_major_formatter(myFmt)
axs[0].set_ylim(0,4)

heatmap = axs[1].contourf(cloudmask_df_mod.index, cloudmask_df_mod.columns / 1000, cloudmask_df_mod.T, levels = [-1, 0, 1])
axs[1].set_ylabel('Height (km)')
axs[1].set_title('Modified')
axs[1].xaxis.set_major_formatter(myFmt)
axs[1].set_ylim(0,4)
plt.tight_layout()

cbar = fig.colorbar(heatmap, ax=axs[:], ticks = [-0.5, 0.5], label = "Cloud Mask")
cbar.ax.set_yticklabels(['Clear','Cloud'], rotation = 90)
cbar.ax.tick_params(size=0)
plt.show()
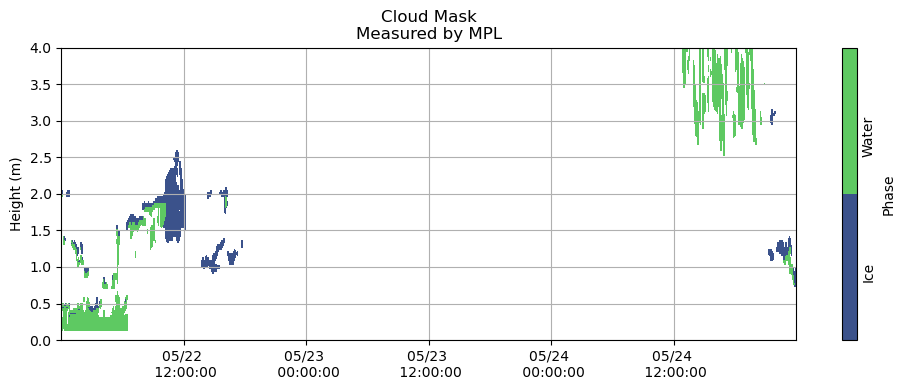
fns = ['/Volumes/seagate_desktop/data/MPL/Robert_MPLData/FinalNICELidarData/NICE_MPLDataFinal20150522.cdf',
       '/Volumes/seagate_desktop/data/MPL/Robert_MPLData/FinalNICELidarData/NICE_MPLDataFinal20150523.cdf',
       '/Volumes/seagate_desktop/data/MPL/Robert_MPLData/FinalNICELidarData/NICE_MPLDataFinal20150524.cdf']

measured_cloudmask_all = pd.DataFrame()

for fn in fns:
    rbt_cldmask = xr.open_dataset(fn)
    # Time is in UTC time stamp in fractional hours
    Time = rbt_cldmask.variables['DataTime'].values
    # Fix time to be a timestamp - Currently in hours
    yy = 2015
    mm = int(fn[-8:-6])
    dd = int(fn[-6:-4])
    date = [datetime(yy,mm,dd) + timedelta(seconds=hr*3600) for hr in Time[~np.isnan(Time)]]
    measured_cloudmask = pd.DataFrame(rbt_cldmask['PhaseMask'][~np.isnan(Time)].values, index = date, columns = rbt_cldmask['Range'])
    measured_cloudmask_all = pd.concat([measured_cloudmask_all, measured_cloudmask])

fig, ax = plt.subplots(figsize=(10,4))

plt.grid()
heatmap = plt.contourf(measured_cloudmask_all.index,
                       measured_cloudmask_all.columns / 1000,
                       measured_cloudmask_all.T.values,
                       [0, 1, 2])
# nan - no information
# 1 - cloud liquid
# 2 - cloud ice

plt.title('Cloud Mask\nMeasured by MPL')
plt.ylabel('Height (m)')
cbar = fig.colorbar(heatmap, label = 'Phase', ticks = [0.5, 1.5], orientation = 'vertical')
cbar.ax.set_yticklabels(['Ice', 'Water'], rotation = 90)
cbar.ax.tick_params(size=0)
plt.gca().xaxis.set_major_formatter(myFmt)
plt.ylim(0, 4)
plt.tight_layout()
plt.show()
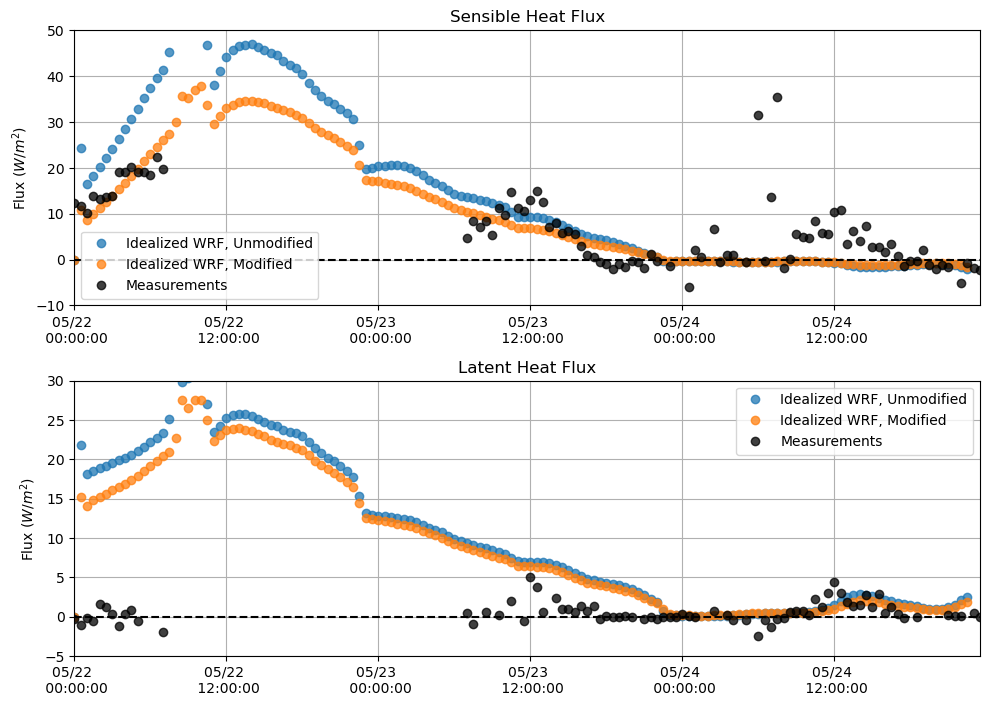
Sensible and Latent Heat Flux
plt.figure(figsize = (10,7))
plt.subplot(211)
plt.plot(sh_df, 'o', alpha = 0.75)
plt.plot(sh_df_mod, 'o', alpha = 0.75)
plt.plot(M_sen[sdate:edate], 'o', alpha = 0.75, color = 'k')
plt.hlines(0, xmin = M_lat[sdate:edate].index[0], xmax = M_lat[sdate:edate].index[-1], linestyle = '--', color = 'k')
plt.ylabel('Flux $(W/m^{2})$')
plt.title('Sensible Heat Flux')
plt.grid()
plt.legend(['Idealized WRF, Unmodified', 'Idealized WRF, Modified', 'Measurements'])
plt.ylim(-10,50)
plt.xlim(M_lat[sdate:edate].index[0],M_lat[sdate:edate].index[-1])
plt.gca().xaxis.set_major_formatter(myFmt)

plt.subplot(212)
plt.plot(lh_df, 'o', alpha = 0.75)
plt.plot(lh_df_mod, 'o', alpha = 0.75)
plt.plot(M_lat[sdate:edate], 'o', alpha = 0.75, color = 'k')
plt.hlines(0, xmin = M_lat[sdate:edate].index[0], xmax = M_lat[sdate:edate].index[-1], linestyle = '--', color = 'k')
plt.ylabel('Flux $(W/m^{2})$')
plt.title('Latent Heat Flux')
plt.grid()
plt.ylim(-5,30)
plt.legend(['Idealized WRF, Unmodified', 'Idealized WRF, Modified', 'Measurements'])
plt.xlim(M_lat[sdate:edate].index[0],M_lat[sdate:edate].index[-1])
plt.tight_layout()
plt.gca().xaxis.set_major_formatter(myFmt)
plt.show()
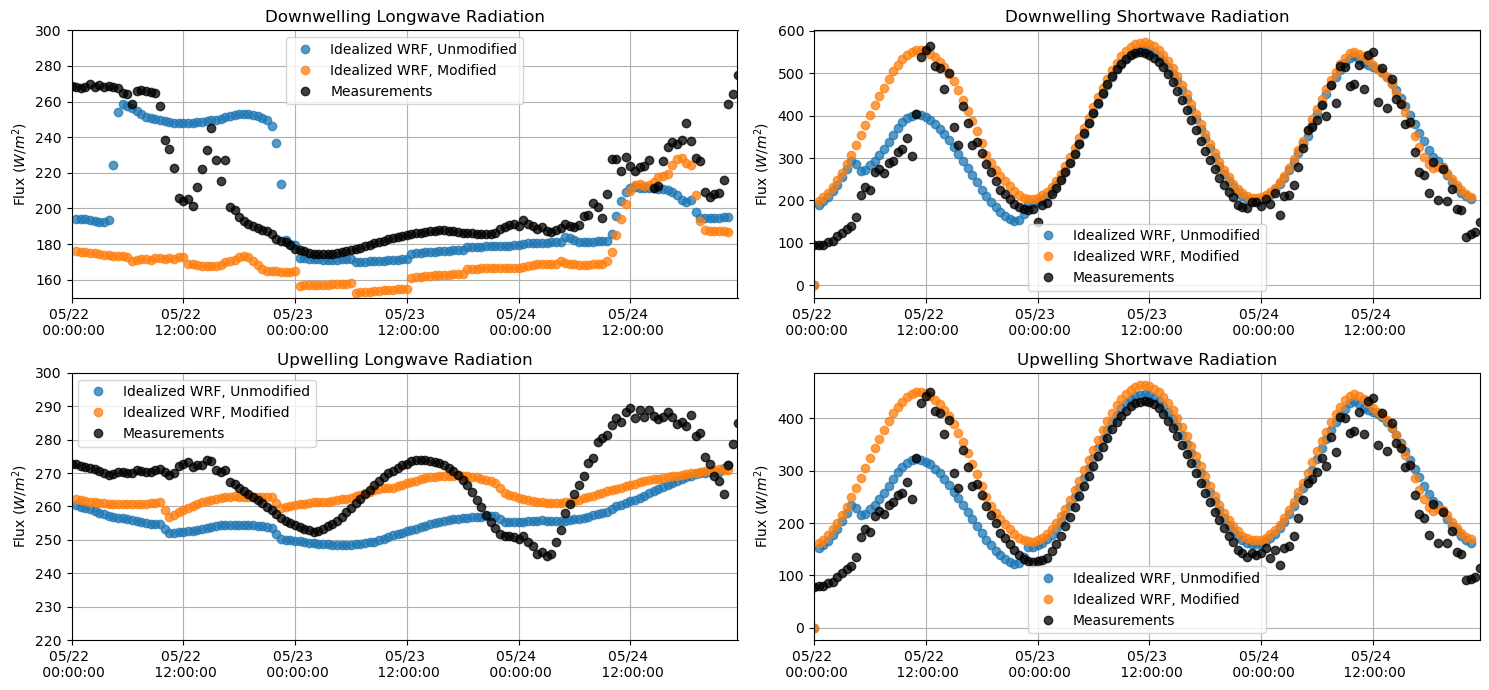
Longwave and Shortwave Radiation
plt.figure(figsize = (15,7))
plt.subplot(221)
plt.plot(lwdnb_df, 'o', alpha = 0.75)
plt.plot(lwdnb_df_mod, 'o', alpha = 0.75)
plt.plot(M_downlw[sdate:edate], 'o', alpha = 0.75, color = 'k')
plt.ylabel('Flux $(W/m^{2})$')
plt.title('Downwelling Longwave Radiation')
plt.grid()
plt.legend(['Idealized WRF, Unmodified', 'Idealized WRF, Modified', 'Measurements'])
plt.ylim(150,300)
plt.xlim(M_downlw[sdate:edate].index[0],M_downlw[sdate:edate].index[-1])
plt.gca().xaxis.set_major_formatter(myFmt)

plt.subplot(223)
plt.plot(lwupb_df, 'o', alpha = 0.75)
plt.plot(lwupb_df_mod, 'o', alpha = 0.75)
plt.plot(M_uplw[sdate:edate], 'o', alpha = 0.75, color = 'k')
plt.ylabel('Flux $(W/m^{2})$')
plt.title('Upwelling Longwave Radiation')
plt.grid()
plt.ylim(220,300)
plt.legend(['Idealized WRF, Unmodified', 'Idealized WRF, Modified', 'Measurements'])
plt.xlim(M_downlw[sdate:edate].index[0],M_downlw[sdate:edate].index[-1])
plt.gca().xaxis.set_major_formatter(myFmt)

plt.subplot(222)
plt.plot(swdnb_df, 'o', alpha = 0.75)
plt.plot(swdnb_df_mod, 'o', alpha = 0.75)
plt.plot(M_downsw[sdate:edate], 'o', alpha = 0.75, color = 'k')
plt.ylabel('Flux $(W/m^{2})$')
plt.title('Downwelling Shortwave Radiation')
plt.grid()
plt.legend(['Idealized WRF, Unmodified', 'Idealized WRF, Modified', 'Measurements'])
#plt.ylim(180,300)
plt.xlim(M_downlw[sdate:edate].index[0],M_downlw[sdate:edate].index[-1])
plt.gca().xaxis.set_major_formatter(myFmt)

plt.subplot(224)
plt.plot(swupb_df, 'o', alpha = 0.75)
plt.plot(swupb_df_mod, 'o', alpha = 0.75)
plt.plot(M_upsw[sdate:edate], 'o', alpha = 0.75, color = 'k')
plt.ylabel('Flux $(W/m^{2})$')
plt.title('Upwelling Shortwave Radiation')
plt.grid()
#plt.ylim(180, 300)
plt.legend(['Idealized WRF, Unmodified', 'Idealized WRF, Modified', 'Measurements'])
plt.xlim(M_downlw[sdate:edate].index[0],M_downlw[sdate:edate].index[-1])
plt.gca().xaxis.set_major_formatter(myFmt)
plt.tight_layout()
plt.show()
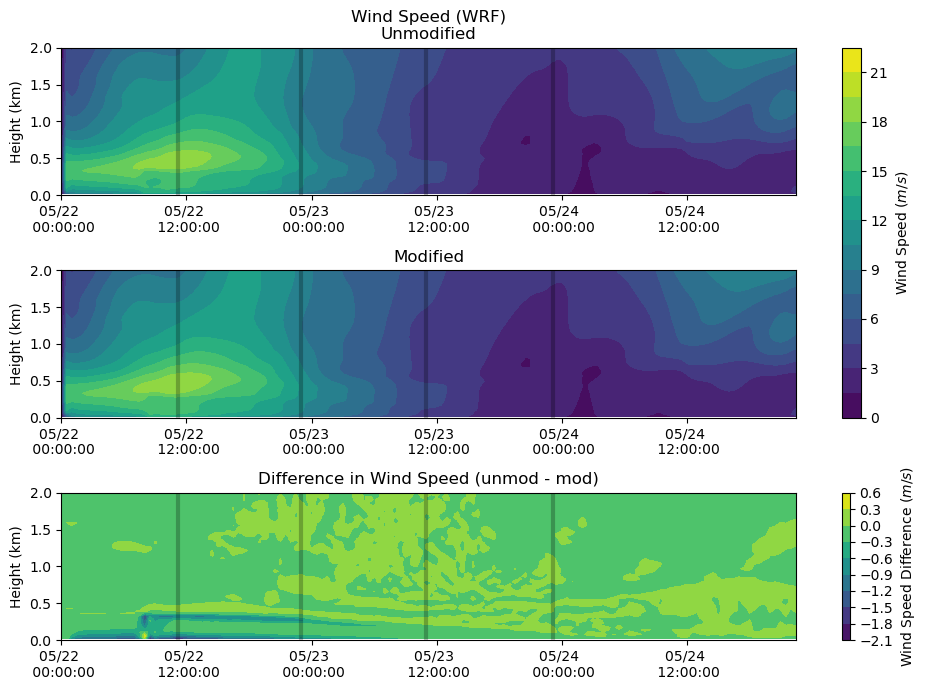
Wind Speed
fig, axs = plt.subplots(3, figsize=(10,7))

heatmap = axs[0].contourf(ws_df.index, ws_df.columns / 1000, ws_df.T.values, levels = 20)
axs[0].set_ylabel('Height (km)')
axs[0].set_title('Wind Speed (WRF)\nUnmodified')
axs[0].xaxis.set_major_formatter(myFmt)
axs[0].set_ylim(0,2)
axs[0].vlines(sounding_ws[sdate:'2015-05-24'].index, 0, 2, color = 'k', alpha = 0.25, lw = 3)

heatmap = axs[1].contourf(ws_df_mod.index, ws_df_mod.columns / 1000, ws_df_mod.T.values, levels = 20)
axs[1].set_ylabel('Height (km)')
axs[1].set_title('Modified')
axs[1].xaxis.set_major_formatter(myFmt)
axs[1].set_ylim(0,2)
axs[1].vlines(sounding_ws[sdate:'2015-05-24'].index, 0, 2, color = 'k', alpha = 0.25, lw = 3)

heatmap_1 = axs[2].contourf(ws_df.index, ws_df.columns / 1000, ws_df.T.values - ws_df_mod.T.values)
axs[2].set_ylabel('Height (km)')
axs[2].set_title('Difference in Wind Speed (unmod - mod)')
axs[2].xaxis.set_major_formatter(myFmt)
axs[2].set_ylim(0,2)
axs[2].vlines(sounding_ws[sdate:'2015-05-24'].index, 0, 2, color = 'k', alpha = 0.25, lw = 3)

plt.tight_layout()
cbar = fig.colorbar(heatmap, ax=axs[0:2])
cbar.set_label('Wind Speed ($m/s$)')

cbar = fig.colorbar(heatmap_1, ax=axs[2])
cbar.set_label('Wind Speed Difference ($m/s$)')

plt.show()
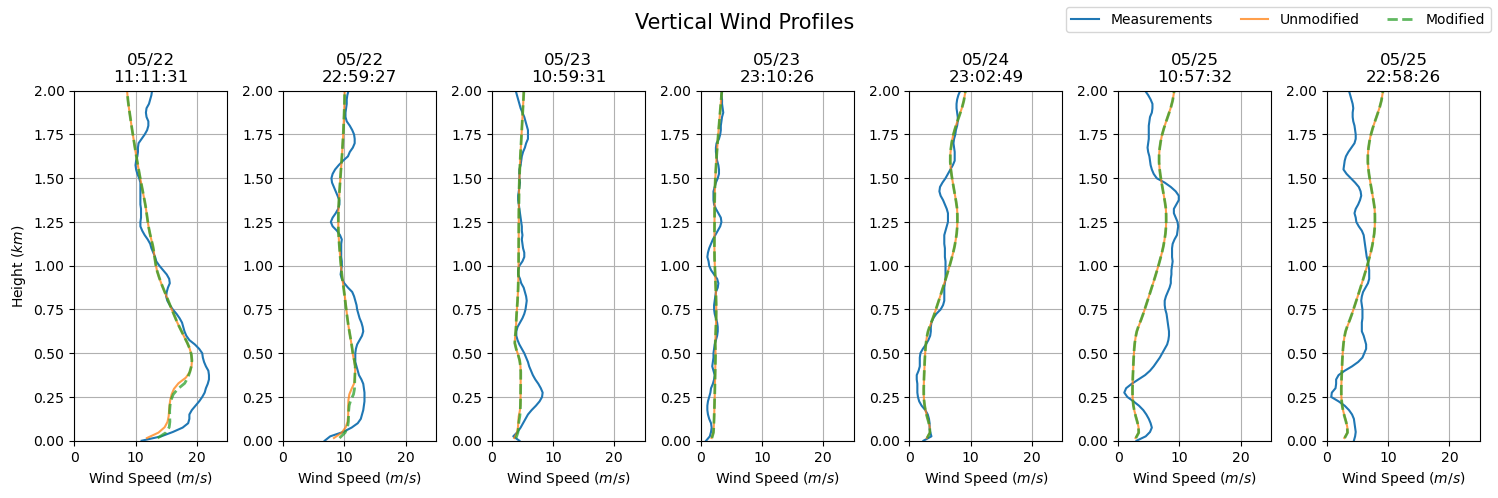
dates = sounding_ws[sdate:'2015-05-25'].index
fig, axs = plt.subplots(ncols = len(dates), figsize=(15,5))

for i in np.arange(0, len(dates), 1):
    prof = axs[i].plot(sounding_ws.loc[dates[i]], sounding_ws.loc[dates[i]].index / 1000, label = 'Measurements')
    axs[i].set_ylim(0, 2)
    axs[i].grid()
    axs[i].set_xlim(0, 25)
    axs[i].set_xlabel('Wind Speed ($m/s$)')
    axs[i].set_title(dates[i].strftime('%m/%d') + '\n' + dates[i].strftime('%H:%M:%S'))

    axs[i].plot(ws_df.iloc[ws_df.index.get_loc(dates[i], method = 'nearest')],
                ws_df.iloc[ws_df.index.get_loc(dates[0], method = 'nearest')].index / 1000,
                label = 'Unmodified', alpha = 0.75)
    axs[i].plot(ws_df_mod.iloc[ws_df_mod.index.get_loc(dates[i], method = 'nearest')],
                ws_df_mod.iloc[ws_df_mod.index.get_loc(dates[0], method = 'nearest')].index / 1000,
                '--', label = 'Modified', alpha = 0.75, lw = 2)

axs[0].set_ylabel('Height ($km$)')
plt.suptitle('Vertical Wind Profiles', fontsize = 15)
plt.tight_layout()

handles, labels = axs[0].get_legend_handles_labels()
fig.legend(handles, labels, loc='upper right', ncol = 3)

plt.show()
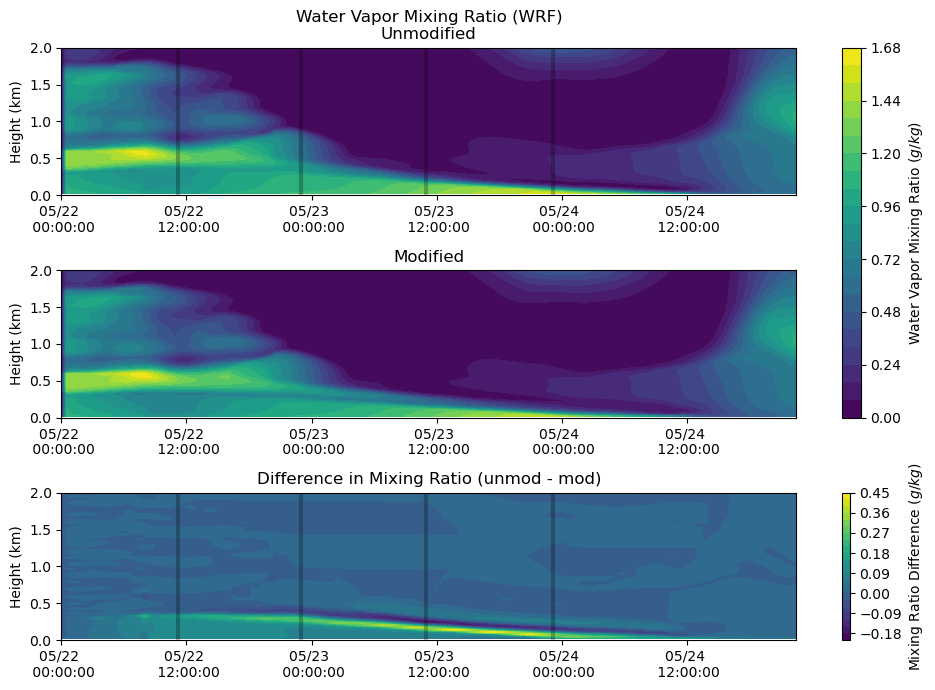
Moisture
fig, axs = plt.subplots(3, figsize=(10,7))

heatmap = axs[0].contourf(qv_df_mod.index, qv_df.columns / 1000, qv_df.T.values * 1000, levels = 20)
axs[0].set_ylabel('Height (km)')
axs[0].set_title('Water Vapor Mixing Ratio (WRF)\nUnmodified')
axs[0].xaxis.set_major_formatter(myFmt)
axs[0].set_ylim(0,2)
axs[0].vlines(sounding_ws[sdate:'2015-05-24'].index, 0, 2, color = 'k', alpha = 0.25, lw = 3)

heatmap = axs[1].contourf(qv_df_mod.index, qv_df_mod.columns / 1000, qv_df_mod.T.values * 1000, levels = 20)
axs[1].set_ylabel('Height (km)')
axs[1].set_title('Modified')
axs[1].xaxis.set_major_formatter(myFmt)
axs[1].set_ylim(0,2)
axs[1].vlines(sounding_ws[sdate:'2015-02-24'].index, 0, 2, color = 'k', alpha = 0.25, lw = 3)

heatmap_1 = axs[2].contourf(qv_df_mod.index, qv_df.columns / 1000,
                            (qv_df.T.values * 1000) - (qv_df_mod.T.values * 1000), levels = 20)
axs[2].set_ylabel('Height (km)')
axs[2].set_title('Difference in Mixing Ratio (unmod - mod)')
axs[2].xaxis.set_major_formatter(myFmt)
axs[2].set_ylim(0,2)
axs[2].vlines(sounding_ws[sdate:'2015-05-24'].index, 0, 2, color = 'k', alpha = 0.25, lw = 3)

plt.tight_layout()
cbar = fig.colorbar(heatmap, ax=axs[0:2])
cbar.set_label('Water Vapor Mixing Ratio ($g/kg$)')

cbar = fig.colorbar(heatmap_1, ax=axs[2])
cbar.set_label('Mixing Ratio Difference ($g/kg$)')

plt.show()
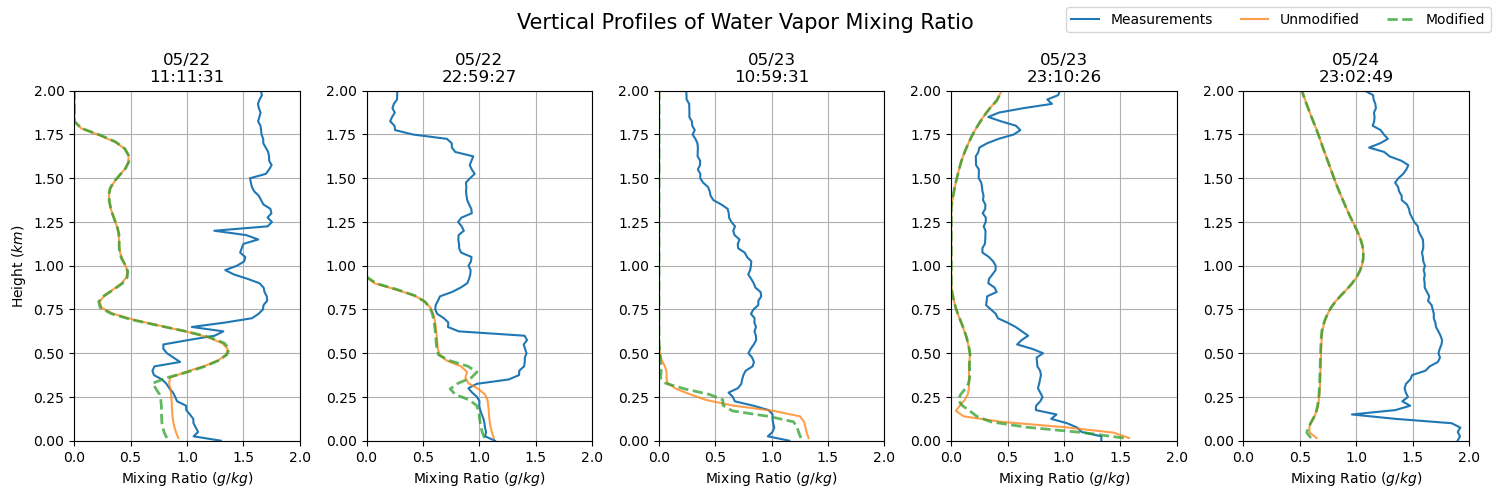
dates = sfc_mixing_ratio[sdate:'2015-05-24'].index
fig, axs = plt.subplots(ncols = len(dates), figsize=(15,5))

for i in np.arange(0, len(dates), 1):
    prof = axs[i].plot(sfc_mixing_ratio.loc[dates[i].to_pydatetime()],
                       sfc_mixing_ratio.loc[dates[i].to_pydatetime()].index.astype(float) / 1000,
                       label = 'Measurements')
    axs[i].set_ylim(0, 2)
    axs[i].grid()
    axs[i].set_xlim(0, 2)
    axs[i].set_xlabel('Mixing Ratio ($g/kg$)')
    axs[i].set_title(dates[i].strftime('%m/%d') + '\n' + dates[i].strftime('%H:%M:%S'))

    axs[i].plot(qv_df.iloc[qv_df.index.get_loc(dates[i].to_pydatetime(), method = 'nearest')] * 1000,
                qv_df.iloc[qv_df.index.get_loc(dates[i].to_pydatetime(), method = 'nearest')].index / 1000,
                label = 'Unmodified', alpha = 0.75)
    axs[i].plot(qv_df_mod.iloc[qv_df_mod.index.get_loc(dates[i].to_pydatetime(), method = 'nearest')] * 1000,
                qv_df_mod.iloc[qv_df_mod.index.get_loc(dates[i].to_pydatetime(), method = 'nearest')].index / 1000,
                '--', label = 'Modified', alpha = 0.75, lw = 2)

axs[0].set_ylabel('Height ($km$)')
plt.suptitle('Vertical Profiles of Water Vapor Mixing Ratio', fontsize = 15)
plt.tight_layout()

handles, labels = axs[0].get_legend_handles_labels()
fig.legend(handles, labels, loc='upper right', ncol = 3)

plt.show()
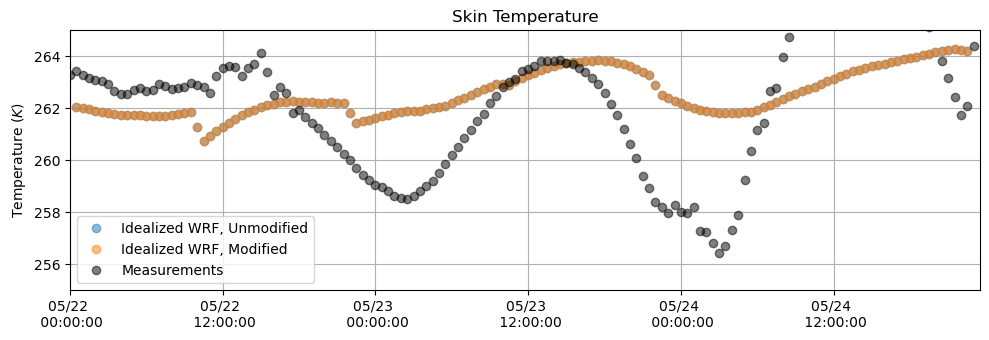
Temperature
plt.figure(figsize = (10,3.5))
plt.plot(tsk_df, 'o', alpha = 0.5)
plt.plot(tsk_df_mod, 'o', alpha = 0.5)
plt.plot(T_meas[sdate:edate].resample('30min').first(), 'o', alpha = 0.5, color = 'k')
plt.ylabel('Temperature $(K)$')
plt.title('Skin Temperature')
plt.grid()
plt.legend(['Idealized WRF, Unmodified', 'Idealized WRF, Modified', 'Measurements'])
plt.ylim(255,265)
plt.xlim(M_downlw[sdate:edate].index[0],M_downlw[sdate:edate].index[-1])
plt.gca().xaxis.set_major_formatter(myFmt)
plt.tight_layout()
plt.show()
Summary Table
Red highlighting indicates the lowest correlation of that variable, green indicates the highest.
edate = '2015-05-24 22:30:00'
lwdns = M_downlw[sdate:edate]
lwdns.columns = ['measured']
lwdns['unmodified'] = lwdnb_df[sdate:edate]
lwdns['modified'] = lwdnb_df_mod[sdate:edate]

lwups = M_uplw[sdate:edate]
lwups.columns = ['measured']
lwups['unmodified'] = lwupb_df[sdate:edate]
lwups['modified'] = lwupb_df_mod[sdate:edate]

swdns = M_downsw[sdate:edate]
swdns.columns = ['measured']
swdns['unmodified'] = swdnb_df[sdate:edate]
swdns['modified'] = swdnb_df_mod[sdate:edate]

swups = M_upsw[sdate:edate]
swups.columns = ['measured']
swups['unmodified'] = swupb_df[sdate:edate]
swups['modified'] = swupb_df_mod[sdate:edate]

lhs = M_lat[sdate:edate]
lhs.columns = ['measured']
lhs['unmodified'] = lh_df[sdate:edate]
lhs['modified'] = lh_df_mod[sdate:edate]

shs = M_sen[sdate:edate]
shs.columns = ['measured']
shs['unmodified'] = sh_df[sdate:edate]
shs['modified'] = sh_df_mod[sdate:edate]
correlation_coefficients = pd.DataFrame([lhs.corr()['measured'].values,
                                         shs.corr()['measured'].values,
                                         lwdns.corr()['measured'].values,
                                         lwups.corr()['measured'].values,
                                         swdns.corr()['measured'].values,
                                         swups.corr()['measured'].values],
                                         columns = lhs.corr().columns,
                                         index = ['Latent', 'Sensible', 'Downwelling Longwave', 'Upwelling Longwave', 'Downwelling Shortwave', 'Upwelling Shortwave']).T
cc_3 = correlation_coefficients
r_squared = correlation_coefficients ** 2
rs_3 = r_squared
r_squared[1:].style.highlight_max(color = 'lightgreen', axis = 0).highlight_min(color = 'pink', axis = 0)
| Latent | Sensible | Downwelling Longwave | Upwelling Longwave | Downwelling Shortwave | Upwelling Shortwave | |
|---|---|---|---|---|---|---|
| unmodified | 0.019199 | 0.399344 | 0.142917 | 0.011557 | 0.801807 | 0.803250 |
| modified | 0.018927 | 0.390447 | 0.070061 | 0.001145 | 0.821090 | 0.840806 |
Statistics and Summary
mean_cc = (cc_3.iloc[:,0:4] + cc_2.iloc[:,0:4] + cc_1)/3
mean_cc_sw = ((cc_3.iloc[:,4:6] + cc_2.iloc[:,4:6])/2)
mean_cc = pd.concat([mean_cc, mean_cc_sw])

mean_rs = (rs_3.iloc[:,0:4] + rs_2.iloc[:,0:4] + rs_1)/3
mean_rs_sw = ((rs_3.iloc[:,4:6] + rs_2.iloc[:,4:6])/2)
mean_rs = pd.concat([mean_rs, mean_rs_sw], axis=1, join="inner")

mean_rs[1:].style.highlight_max(color = 'lightgreen', axis = 0).highlight_min(color = 'pink', axis = 0)
| Latent | Sensible | Downwelling Longwave | Upwelling Longwave | Downwelling Shortwave | Upwelling Shortwave | |
|---|---|---|---|---|---|---|
| unmodified | 0.007632 | 0.145286 | 0.315652 | 0.209108 | 0.843545 | 0.843282 |
| modified | 0.009108 | 0.147682 | 0.307759 | 0.205637 | 0.853632 | 0.868321 |